Database Reference
In-Depth Information
Be aware that to use real-time monitoring, the Tuning Pack option must be licensed. In addition, real-time
monitoring is only available from 11.1 onward. If the
control_management_pack_access
initialization isn't set to
diagnostic+tuning
, real-time monitoring is disabled.
Because it makes no sense to monitor all executions, by default the database engine enables monitoring in three
specific cases only:
•
For executions that consume at least 5 seconds of combined CPU and disk I/O time
•
For executions that use parallel processing
•
For SQL statements that explicitly enable real-time monitoring by specifying the
monitor
hint
(it's also possible to explicitly disable it with the
no_monitor
hint)
■
In two situations, the database engine can silently disable real-time monitoring for specific executions.
First, when an execution plan exceeds 300 lines. Second, when more than 20 concurrent executions per CPu are monitored.
To overcome these limitations, you can increase the default value of the
_sqlmon_max_planlines
and
_sqlmon_max_plan
undocumented initialization parameters, respectively. because higher values can result in higher CPu and memory
consumption, you shoudn't unnecessarily set them to very high values without carefully testing the modification.
Caution
To see which operations were or are currently monitored, you can either directly query the
v$sql_monitor
view
or execute the
report_sql_monitor_list
function of the
dbms_sqltune
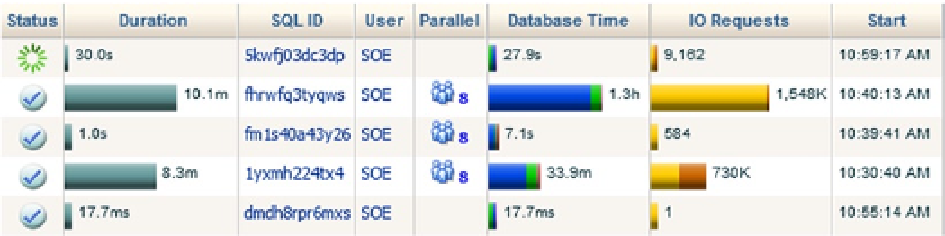
package. Through them, for each monitored
execution, the database engine provides basic information, such as whether the operation is still in execution and the
SQL statement related to the monitored operations, as well as key performance figures like DB time utilization. As an
example, Figure
4-10
shows part of the information provided by Enterprise Manager.
Figure 4-10.
List of the monitored operations
To get all information gathered by real-time monitoring, you need to generate a report through the
report_sql_monitor
function of the
dbms_sqltune
package. Such an operation can be executed from any tool that
can run SQL statements, as well as from several pages in Enterprise Manager (for example, via the SQL Monitoring
link in the Performance menu). The
report_sql_monitor
function accepts a number of input parameters and returns
a CLOB containing the report. Several of the input parameters can be used to target the monitoring information to
display, and others are used to specify the format of the report or the data that has to be displayed. For example, with
the
sql_id
parameter, you specify which SQL statement the information is to be displayed for (if
NULL
is specified,
the last monitored operation is reported), and with the
type
parameter, you specify the format of the report to be
generated (for best results, I advise you to use
active
;
text
,
html
, and
xml
are also available). The following query,
an excerpt from the
report_sql_monitor.sql
script, shows an example of how to generate such a report: