Database Reference
In-Depth Information
ACTIVITY_PCT DB_TIME SQL_ID
------------ ---------- -------------
29.9 1008 c13sma6rkr27c
11.3 382 0yas01u2p9ch4
11.2 376 0y1prvxqc2ra9
9.5 321 7hk2m2702ua0g
8.2 277 bymb3ujkr3ubk
7.8 263 8dq0v1mjngj7t
5.8 196 8z3542ffmp562
4.2 142 0bzhqhhj9mpaa
2.8 93 5mddt5kt45rg3
1.3 44 0w2qpuc6u2zsp
If you have access to Enterprise Manager 12c (Cloud Control or Express), you can also query the content of active
session history with the help of
ASH Analytics
. The purpose of ASH Analytics is to allow you to perform an analysis
without having to write SQL queries that directly access the
v$active_session_history
view. Simply put, with it you
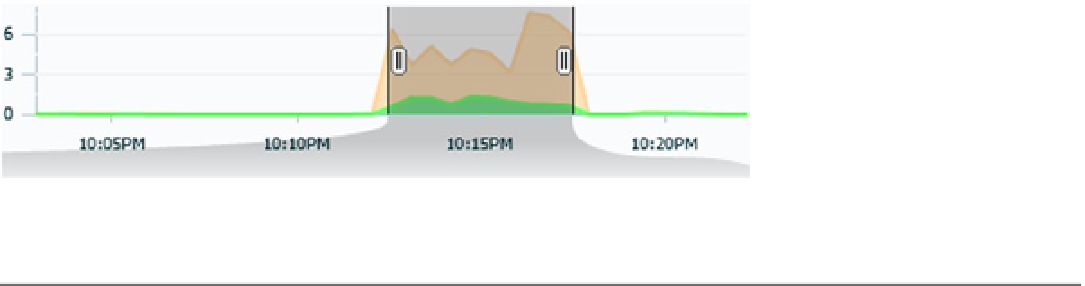
select the period by positioning a slider on a chart providing a timeline and overview of the load experienced by the
database instance (illustrated by Figure
4-5
), pick out one or several dimensions according to which one you want to
aggregate the data to (a dropdown list containing more than two dozen alternatives is available), and choose how to
format the displayed data.
Figure 4-5.
Selecting the time period of the analysis in ASH Analytics
■
Even though aSh analytics is an Enterprise Manager feature, it requires some object to be installed database
side. Those objects are installed by default only from version 11.2.0.4 onward. In previous versions, an installation is
required. When you try to use aSh analytics on a database without those objects, Enterprise Manager suggests you install
them. be aware that aSh analytics isn't available in version 10.2.
Note
The data can be arranged according to three main formats:
•
An
activity chart
shows, for the selected dimension, the variation in the average number of
active session over the selected period of time. As an example, Figure
4-6
shows the number of
active sessions for the top 10 SQL statements over the 5-minute period selected in Figure
4-5
.