Database Reference
In-Depth Information
58 END IF;
59 END IF;
60 END IF;
61 END LOOP;
...
69 0.0 1 END perfect_triangles;
Oracle distributes two scripts that provide examples of queries against the profiling data:
•
If the example files are installed (which isn't the case by default), a script called
profrep.sql
is available in the
$ORACLE_HOME/plsql/demo/
directory.
Through the Oracle Support note
•
Script to produce HTML report with top consumers out of
PL/SQL Profiler DBMS_PROFILER data
(243755.1).
Using a GUI
In addition to the manual method covered in the previous section, it's also possible to use one of the graphical
interfaces available in third-party products. Such an interface is provided by the major players such as PL/SQL
Developer (Allround Automations), SQLDetective (Conquest Software Solutions), Toad and SQL Navigator (Dell),
or Rapid SQL (Embarcadero). All these tools can be used to profile the code, usually by clicking a check box or button
before running a test or by simply analyzing the content of the output tables.
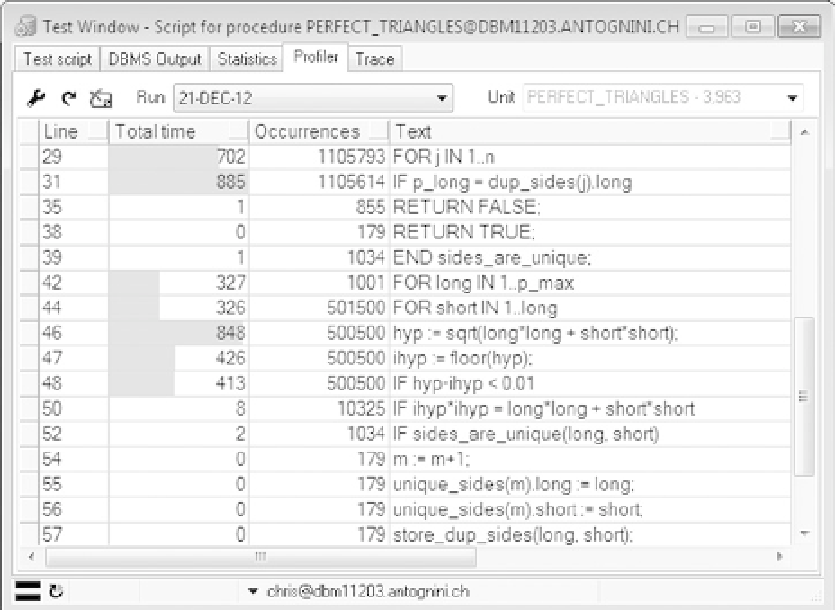
As an example, Figure
3-11
shows the information provided by PL/SQL Developer for the profiling session
illustrated in the previous sections. Notice the graphical representation in the “Total time” column that highlights the
major time-consuming lines of code.