Database Reference
In-Depth Information
Using PLSHPROF
You can use the command-line utility PLSHPROF to process a trace file generated by
dbms_hprof
. In doing so, you
generate a collection of HTML reports. If you run PLSHPROF without specifying any argument as input, you get a
complete list of PLSHPROF's arguments including a short description:
Usage: plshprof [<option>...] <tracefile1> [<tracefile2>]
Options:
-trace <symbol> (no default) specify function name of tree root
-skip <count> (default=0) skip first <count> invokations
-collect <count> (default=1) collect info for <count> invokations
-output <filename> (default=<symbol>.html or <tracefile1>.html)
-summary print time only
As you can see, it's possible to specify one or two trace files and several options. If a single trace file is specified,
PLSHPROF generates the following reports:
•
Function elapsed time data sorted according to eight different criteria
•
Module elapsed time data sorted according to three different criteria
•
Namespace elapsed time data sorted according to three different criteria
•
For example, issue the following command to process the
dbms_hprof.trc
trace file and generate a set of reports
that can be accessed through a file named
dbms_hprof.html
:
Parents and children elapsed time data
plshprof -output dbms_hprof dbms_hprof.trc
Note that both the trace file and the HTML reports are available in the
dbms_hprof.zip
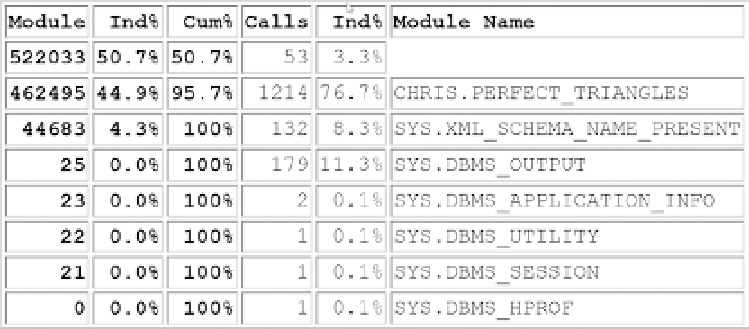
file. Figure
3-5
shows one
of the available reports.
Figure 3-5.
Module Elapsed Time Data Sorted by Total Function Elapsed Time, as generated by PLSHPROF
Specifying two trace files is useful when you want to compare two runs of the same program. For example, you
can specify two trace files and compare them to assess the performance improvement or regression introduced by
code change. If the two trace files aren't identical, PLSHPROF generates a collection of reports similar to the ones
generated for a single trace file, but pointing out the deltas between the two runs.