Environmental Engineering Reference
In-Depth Information
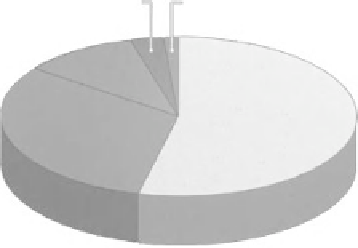
3
″
-4
″
3%
> 4
″
1%
2
″
-3
″
11%
0
″
-1
″
54%
1
″
31%
″
-2
Figure 1-8
Frequency and magnitude of rainfall events, southeastern Pennsylvania. Most
rainfall occurs in small storms, less than the 2-year frequency.
Table 1-4 Two-Year-Frequency Rainfall Event
Two-Year Rainfall
U.S. Region
City
(in. in 24 hr)
Northeast
West Chester, PA
3.3
Northwest
Seattle, WA
3.2
Southeast
Chapel Hill, NC
3.6
Southwest
Los Angeles, CA
2.9
Central
Minneapolis, MN
2.5
that of all the storms of lesser magnitude represents about 95% of the total rainfall
volume over a prolonged period of decades, and so better defines the efficiency
of any proposed mitigation measure. Since this statistic has great significance
as a basis for the design of most of the measures described in this topic, it is
important to compare the variation in this type of rain event in different portions
of the country. Table 1-4 shows the 2-year-frequency rainfall in major regions,
and the values are quite similar. Figure 1-9 illustrates the intensity of this type of
storm over a 24-hour period (as well as the 100-year rainfall) for a mid-Atlantic
watershed. This is described by an S-curve, developed by the Soil Conservation
Service of the U.S. Department of Agriculture during the 1960s [11]. Of course,
nature never cooperates with our assumptions concerning climate conditions such
as rainfall patterns, but this type of distribution is assumed because it will produce
the most extreme runoff conditions.
1.3 ARID ENVIRONMENTS: THE SOUTHERN CALIFORNIA MODEL
To be sustainable, low-impact design (LID) must consider all human demands
on the hydrologic cycle that result from the land development process. This
means that we begin our site planning with the issue of water supply, the single


Search WWH ::

Custom Search