Environmental Engineering Reference
In-Depth Information
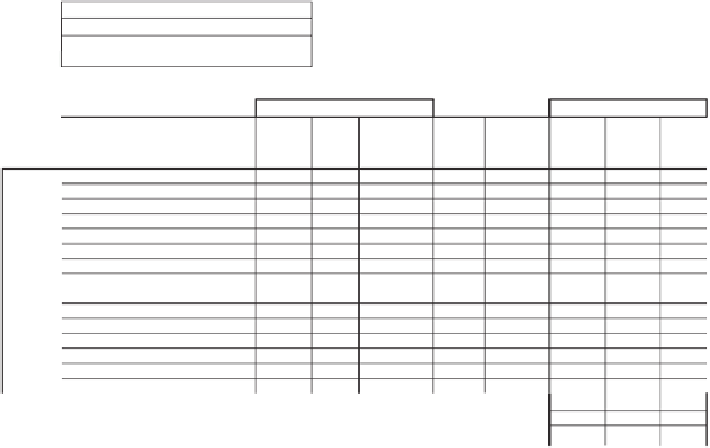
WORKSHEET 12. WATER QUALITY ANALYSIS OF POLLUTANT LOADING FROM ALL
DISTURBED AREAS
TOTAL SITE AREA (AC)
TOTAL DISTURBED AREA (AC)
DISTURBED AREA
CONTROLLED BY BMPs (AC)
TOTAL DISTURBED AREAS:
POLLUTANT
POLLUTANT LOAD
TSS
EMC
(mg/l)
TP
EMC
(mg/l)
Nitrate-
Nitrite EMC
(mg/l as N)
RUNOFF
VOLUME
(AF)
NO
3
(LBS)
LAND COVER
CLASSIFICATION
COVER
(Acres)
TSS**
(LBS)
TP**
(LBS)
Forest
39
0.15
0.17
Meadow
Fertilized Planting Area
Native Planting Area
Lawn, Low-Input
Lawn, High-Input
Golf Course Fairway/Green
Grassed Athletic Field
47
0.19
0.3
55
1.34
0.73
0.33
55
0.40
0.40
0.44
1.46
180
2.22
180
1.07
1.84
305
200
1.07
1.01
Rooftop
High Traffic Street / Highway
Medium Traffic Street
Low Traffic / Residential Street
21
0.13
0.32
261
0.40
0.83
0.33
113
0.58
86
0.36
0.47
0.46
0.47
Res. Driveway, Play Courts, etc.
60
120
0.39
0.60
High Traffic Parking Lot
58
0.15
0.39
Low Traffic Parking Lot
TOTAL LOAD
85%
85%
50%
REQUIRED REDUCTION (%)
REQUIRED REDUCTION (LBS)
* Pollutant Load = [EMC, mg/l] X [Volume, AF] X [2.7, Unit Conversion]
** TSS and TP calculations only required for projects not meeting CG1/CG2 or not controlling less than 90% of the disturbed area


Search WWH ::

Custom Search