Biology Reference
In-Depth Information
70
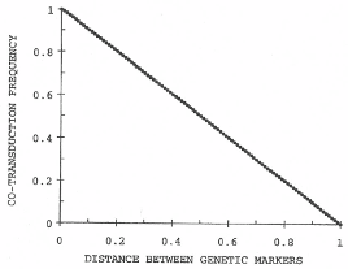
Figure 3-2.
Straight line relation of co-transduction frequency
and distance between genetic markers.
For this reason, many transduction experiments involving three nearby
genetic markers have been performed, known as three-point analyses. It is
thus essential to derive the biologically relevant curve connecting the two
above-mentioned end points. Furthermore, the accumulated data on many
three-point analysis experimental measurements can be used to test the
usefulness of the theoretical curve.
MODEL FOR RANDOM GENERALIZED TRANSDUCTION
The accidental packaging of a piece of
E. coli
chromosomal DNA into the
P1-phage head implies that not only the piece has a fixed length of two
minutes but also that the piece is cut out randomly over the entire
chromosome. The latter property is commonly referred as generalized. Let
the recipient
E. coli
carry a defective gene designated by A-, and the donor
E. coli
the good gene A+. For a typical transduction experiment, we would
like to calculate the chance of obtaining a transductant carrying the A+ gene.
Since the
E. coli
chromosome is circular, two or any even number of cross-
overs are required to maintain the viability of the transductant.
Since cross-