Biology Reference
In-Depth Information
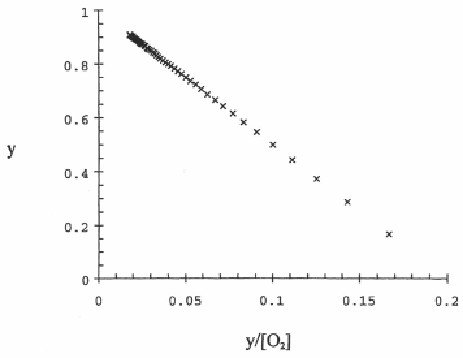
The straight line drawn through the experimental data points intersects the
horizontal axis at 1/K.
Figure 2-5.
The plot of y against y/[O
2
].
Experimental measurements for equilibrium saturation of myoglobin with
oxygen indeed follow the theoretical curves or straight lines as shown in
Figs. 2-3 to 2-5.
EXPERIMENTAL MEASUREMENTS OF SATURATION OF
HEMOGLOBIN WITH OXYGEN AT EQUILIBRIUM
We can easily realize from the saturation curve shown in Fig. 2-2 that
myoglobin would not be a good oxygen carrier protein from our lungs to our
tissues, since the oxygen pressure in our tissues is not near zero. We need a
protein having a steep slope between the oxygen pressures of our tissues and
our lungs. Indeed, hemoglobin has evolved just for that purpose. In order to
understand its properties, careful experimental measurements are essential.
The best study was by Roughton
et al.
in 1955. Their results, together with
experimental error, are listed in Table 2-2.