Biology Reference
In-Depth Information
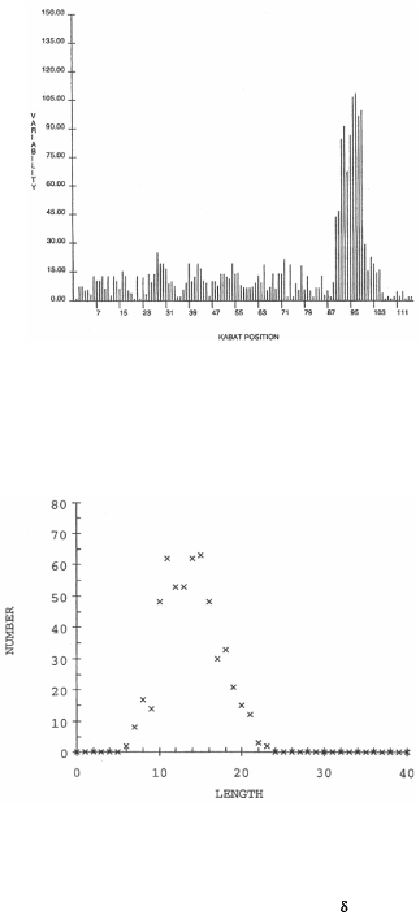
Figure 1-17
. Variability plot for human TCR
chain variable region.
Figure 1-18
. Length distribution of human TCR
chain CDR3's.