Biology Reference
In-Depth Information
8
For actual collections of aligned experimentally determined sequences, this
maximum value is never reached. However, the large range of 1 to 400
gives us sufficient flexibility to analyze the extent of variation of amino acid
residue substitutions at various positions.
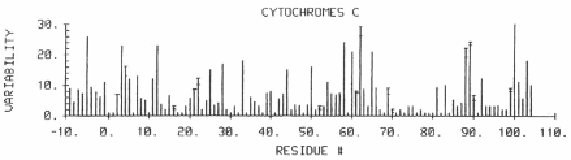
One may ask what the big deal is for this “trivial” analysis. We first applied
this calculation to a collection of sequences of cytochrome c's from different
species provided to us by Dr. Margoliash. Most of them consist of 104
amino acid residues, similar to the length of the variable region of light
chains of immunoglobulins. The plot is shown in Fig. 1-3.
Figure 1-3.
Variability plot for cytochrome c's (Kabat
et al
., 1991).
Indeed, there are many positions with variability equal to one. Furthermore,
the maximum variability is around 30, much smaller than 400.
The interesting part was that for the 107 positions of the light chain variable
region, a plot of variability V against position P showed three distinct peaks,
at positions 24 to 34, 50 to 56, and 89 to 97. That was totally unexpected.
But it was subsequently verified repeatedly, not only for light chains but
also for heavy chains where the peaks are located at positions 31 to 35, 50 to
65, and 95 to 102. Representative plots are shown in Figs. 1-4 and 1-5.