Biology Reference
In-Depth Information
For high initial substrate concentrations (Figs. 4-9, 4-10), the initial rates of
product formation were constant for about 10 minutes and slowed down
somewhat. They remained at the slower constant rate for nearly 100
minutes. At intermediate substrate concentration (Figs. 4-11, 4-12), there
was a short lag of a few minutes, somewhat indicative of the existence of a
transient state discussed above, with a t
c
of around 2 to 6 minutes. Beyond
30 minutes, the rates slowed down gradually. For lower substrate
concentrations (Figs. 4-13 to 4-16), the initial rates could not be maintained
and the rates of product formation leveled off quickly.
NUMERICAL SOLUTION FOR NON-LINEAR RATE EQUATIONS
Since the transition from the initial conditions at t = 0 to the steady states
assumed in simple enzyme kinetics occurs very quickly, usually less than
one or a few minutes, sometimes in seconds or less, numerical calculations
should avoid that time period, or use time increment,
much less than t
c
.
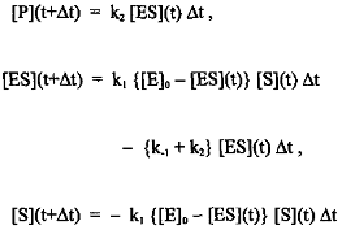
In the simplest approximation, we have:
and
In this situation, [S] is no longer considered as a constant. It will gradually
reduce in concentration. As a result, [ES] will also gradually decrease.
Eventually, the substrate will be exhausted, and [ES] will also approach
zero. Schematically, the time courses of [S], [E], [ES] and [P] are illustrated
in Fig. 4-17. The rate of product generation eventually levels off, as
actually noticed by Michaelis and Menten (1913) for low initial substrate
concentrations (Fig. 4-15, 4-16).