Geoscience Reference
In-Depth Information
Current electrode
Potential
electrodes (M,N)
A
5
ZEL-SIP04-V02
Additional
instrumentation
2.5
Ampliier unit
90˚
Core
0
Computer
45
˚
B
0
˚
Current electrode
-
+
4
A
2
0
-
+
4
M
2
0
Width, cm
-
+
Symmetric array
(redundancy)
N
4
-
+
B
Current
2
90˚
45
˚
Azimuthal
voltage
0
0
˚
Function
generator
0
2
4
Width, cm
(a)
(b)
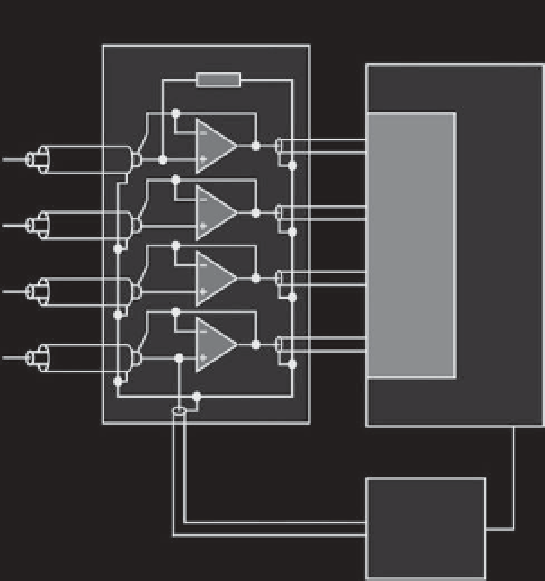
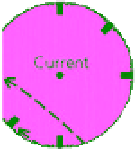
Figure 2.7
Experimental setup to measure complex conductivity.
a)
Position of the electrodes on the core sample. A and B denote
the current electrodes used to inject a harmonic current, while the electrodes M and N denote the voltage electrodes used to
record the harmonic electrical field.
b)
ZEL-SIP04-V02 impedance meter built by Egon Zimmermann in Germany (Zimmermann et al.,
2008). The data acquisition system operates in the frequency range from 1 mHz to 45 kHz with a phase accuracy close to 0.1 mrad
below 1 kHz. This instrument can be used to measure the complex conductivity (amplitude and phase) in the frequency range
1 mHz to 45 kHz. (
See insert for color representation of the figure
.)
k
0
Q
0
V
two unknowns that remain are the charge per unit pore
volume,
Q
V
, and the surface conductivity,
σ
S
. After fitting
the model to the data, we obtain
σ
S
= (1.2 ± 0.3) × 10
−
3
Sm
−
1
and
Q
V
=14±02Cm
−
3
. These two values can
be independently confirmed using our model: (1) the
value of
Q
V
can be independently obtained by the empir-
ical model of Figure 1.9, which yields
Q
0
C
0
≈
2 217
η
w
σ
w
F
+
σ
S
We can use Equation (2.217) to fit the values of the
static coupling coefficient displayed in Figure 2.11, for
the Berea sandstone. Knowing the permeability and
the formation factor of the core sample, the pore water
conductivity, and the viscosity of the pore water, the
V
=20Cm
−
3
.
(2) The surface conductivity can be compared to the
estimate made by Moore et al. (2004) using electrical