Geoscience Reference
In-Depth Information
1.2
CS
Conversions
0.6
Dipole-1
0
DE
−0.6
0
5
10
15
20
25
0.6
DE
Dipole-2
0
−0.6
Conversions
−1.2
CS
0
5
10
15
20
25
Time (ms)
(a)
1.2
Dipole-1
0.6
0
−0.6
0.6
Dipole-2
0
−0.6
−1.2
0
5
10
15
20
25
Time (ms)
(b)
0.6
Seismoelectric conversion
from the water table
0.3
0
Dipole-1
−0.3
Events from 1.5 to11.25 m
intervals
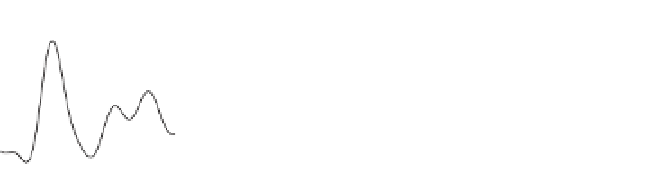
Figure 7.13
Numerical modeling results:
computed signals for dipoles 1 and 2.
a)
Total seismoelectric signals, including
direct field effect (DE), coseismic response
(CS), and seismoelectric conversions.
b)
Coseismic signals only.
c)
Seismoelectric conversion signals,
obtained by subtracting coseismic signals
b)
from total signals. The boxes outline
seismoelectric conversions used
in Figure 7.14.
−0.6
0
5
10
15
20
25
0.6
Seismoelectric conversion
from the water table
0.3
0
Dipole-2
Events from 1.5 to 11.25 m
intervals
−0.3
−0.6
0
5
10
15
20
25
Time (ms)
(c)
While the total seismoelectric signals at the two
dipoles are dominated by the direct field and strong
coseismic energy at early times (<4 ms; annotated in
Figure 7.13a), seismoelectric conversions are dominant
later in time (>4 ms). Numerical simulation of the
coseismic and direct field contributions only
(Figure 7.13b) confirms that coseismic and direct field
contributions are strong only at times less than ~4 ms,