Geoscience Reference
In-Depth Information
of each other. The relationship is robust because volumet-
ric water contents were averaged over several boreholes
and several measurement periods (West and Truss,
2006), while the preprocessed seismoelectric signals were
averaged over some ten repeat shots at four different sites.
We can therefore conclude that judiciously processed seis-
moelectric sounding data can be used to determine the
volumetricwater content in the vadose zone of unconfined
aquifers. We will confirm in the following text, using a
numerical test, this feature. We will show that the seismo-
electric signals are dominated by electrokinetically induced
seismoelectric conversions at times later than ~4ms, after
which coseismic energy returns become negligible.
5
4
3
2
1
0
-1
-2
-3
- 4
-5
35
30
7.2.4 Empirical modeling
Accepting such dominance of seismoelectric conversions
pending confirmation in Section 7.3, we develop an
empirical petrophysical framework. We expect that we
can explain the statistically significant and robust infer-
ences from the framework we develop here and thus
can facilitate the inversion of seismoelectric conversions
for subsurface hydrological properties. We can model a
seismoelectric conversion as the response to a transient
streaming potential and can connect the seismically
induced pressure disturbances propagating through the
vadose zone with the unsaturated electrokinetic coupling
coefficient (e.g., Guichet et al., 2003; Revil & Cerepi,
2004; Kulessa et al., 2012). The streaming potential
generated by differential fluid pressure imposed on a
saturated medium is given by (see Chapter 1)
25
20
15
10
0123456789 0 1
Depth (m)
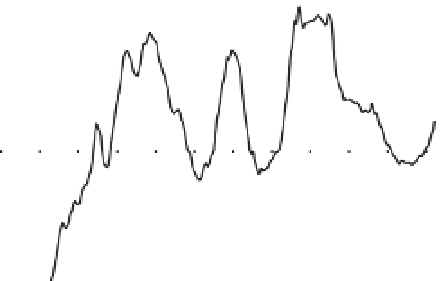
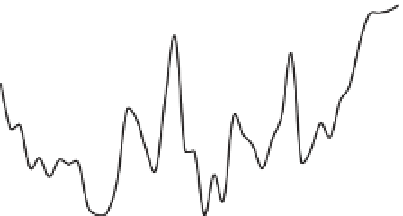
Figure 7.9
Voltage and volumetric water content versus depth.
a)
Seismoelectric conversions from depths of 1.25
11.25 m
following the application of the model described in the main text
with spherical correction applied and smoothed with a 0.25 m
running mean.
b)
Volumetric water content-depth profile from
TDR measurements.
-
6
4
2
0
s
ek
(t)
= −
A
δθ
δ
-2
A = −(33 ±6)mV
(
R
= 0.90)
-4
Figure 7.10
Statistical relationship between
principal spatial amplitudes (picked from
Figure 7.9) of volumetric water content
against those of seismoelectric conversions.
-6
-18
-15
-12
-9
-6
-3
0
3
6
9
12
15
18
Mean water content (peak-to-peak amplitude,
δθ
, %)