Geoscience Reference
In-Depth Information
1
No structure information
0
0
Resistivity (Ohm m)
0.9
0.8
0.6
0.2
0.4
200
0.8
200
400
0.7
400
0.6
600
ℜ
0.5
600
800
0.4
0.3
1000
800
100
200
300
400
Distance (m)
1000
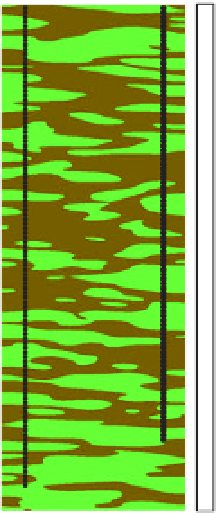
Figure 6.22
Position of the electrodes (black circles, 105
electrodes per well, spacing 10 m) for the cross-well
resistivity tomography and discretization of the domain
(the size of the cells is 10 × 10 m). The resistivity image
denotes the true resistivity image used to simulate the
acquisition of the apparent resistivity data. We are interested
in recovering the resistivity information in domain
ℜ
.
(
See insert for color representation of the figure
.)
100
200
300
400
Distance (m)
Figure 6.23
Result of a classical cross-well resistivity
tomography in domain
ℜ
using the least-square method
without structural information to constrain the model covariance
matrix. Classical cross-well resistivity tomography is unable to
image the formations between the wells due to a lack of
resolution far away from the electrodes. In addition, the values of
the resistivity are smoother than the true values, which mean
that the application of a petrophysical model to the recovered
resistivity would lead to a misinterpretation of the petrophysical
parameters of interest. (
See insert for color representation of the
figure
.)
Typical smoothness
Discrete Laplacian
Structure smoothness
Various format
principle, there should be no issues in building the
seismoelectric image required to perform the image-
guided inversion of ERT data.
6.4 Spectral seismoelectric
beamforming (SSB)
(a)
(b)
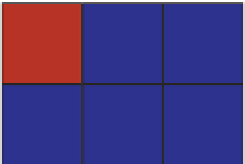
Figure 6.24
Computation of the model covariance matrix
using the detection of boundaries.
a)
The classical discrete
Laplacian correlates each pixel with all the neighbor ones
in an isotropic way.
b)
The structural constrains correlate
only neighbor pixel that belong to the same unit. In our
approach, the structural constraints are imposed from the
seismoelectric image.
We can beamform a pulse but we can also beamform a
harmonic wave field for a range of frequencies. We call
this approach
since the resulting
electrical response can be measured frequency by
frequency and the result will be a spectral seismoelectric
“
spectral beamforming
”