Geoscience Reference
In-Depth Information
200
I
Phase II (drainage)
Phase III (post drainage relaxation)
170
140
110
Typical negative event
0.02 s
14
80
15
16
17
50
18
19
M
20
20
21
M: Magnitude (mV)
22
0.46
0.48
0.5
0.52
0.54
0.56
0.58
0.6
0
Time (s)
0
20
40
60
80
100
120
140
160
180
200
Time (s)
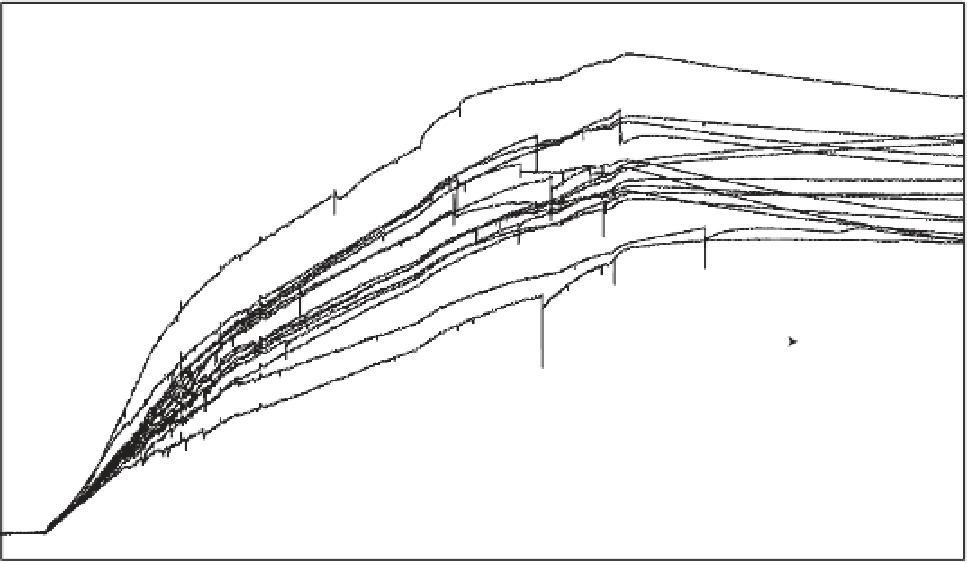
Figure 5.40
Electrograms for a selected set of channels. Phase I corresponds to the data recorded before starting the drainage.
Phase II corresponds to the drainage experiment. Phase III corresponds to the postdrainage data and the relaxation of the water
table. A typical negative event is shown in the insert (voltages are in mV). These anomalies are characterized by a drop in the
electrical potential (characterizing the magnitude of the event) and a relaxation tail.
to the large convergence of flow in the vicinity of the
drain and was modeled recently by Revil et al. (2008)
for a similar situation. However, bursts in the electrical
potential were also observed on top of these expected
low-frequency behaviors. It is these transient signals that
are of most interest. It should be noted that the drainage
was started from a completely saturated sand volume
(saturated to the surface) and that the electrical charac-
teristics at the beginning of the drainage phase are differ-
ent from the electrical characteristics displayed later in
the drainage phase. The drainage phase times of 10
-
25 s
are electrically and acoustically quieter than later time
sections. Since the water was drained through one port,
it is expected that the water table will achieve a nonflat
surface that is higher at the end farthest from the drain
and lowest directly above the drain. Enough water drains
away from the surface of the sand by 30 s into the data set
for the onset of the electrical and acoustic noise behavior
of interest. This noisy behavior continues until drainage
was terminated.
The relaxation region (phase III) shows a significant
DC offset with a negative trend on most channels,
indicating that the water table surface is relaxing to a
constant hydraulic potential surface. Full relaxation of
the surface takes a long time, and it can be seen in
Figure 5.40 that data acquisition was terminated before
relaxation was completed. It should be noted that the
AC electrical and acoustic properties of this region are
quiet except for a few straggling transient events
(Figure 5.40). These straggling events suggest that the
sand volume may be undergoing a combined process
of imbibition with some drainage, while the phreatic
surface equalizes to a constant level possibly including
some localized consolidation of the sand during this
phase of the experiment.
Figure 5.40 shows how the signal characteristics
change as drainage proceeds from being dominated by
purely fluid flow to the invasion of air as it begins to
enter pores initially containing water. Figure 5.41 shows
the electrograms with the low-frequency components