Geoscience Reference
In-Depth Information
Spatial response (mV) - top array
Spatial response (mV) - back array
Time = 1809.4844 s
2.5
4
8
12
16
20
24
28
32
270
270
2
Hole 10
1.5
3
7
11
15
19
23
27
31
1
E2
190
190
0.5
CMS
DRL
0
2
6
10
14
18
22
26
30
110
110
−0.5
−1
Hole 9
1
5
9
13
17
21
25
29
−1.5
30
30
−2
30
110
190
270
20
100
180
260
(a)
(b)
X
-position (mm)
Z
-position (mm)
Spatial response (mV) - back array
Spatial response (mV) - top array
Time = 1850.9844 s
25
4
8
12
16
20
24
28
32
270
270
20
Hole 10
15
3
7
11
15
19
23
27
31
E3
190
190
10
CMS
DRL
5
2
6
10
14
18
22
26
30
110
110
0
Hole 9
−5
1
5
9
13
17
21
25
29
30
30
−10
30
110
190
270
20
100
180
260
(c)
(d)
X
-position (mm)
Z
-position (mm)
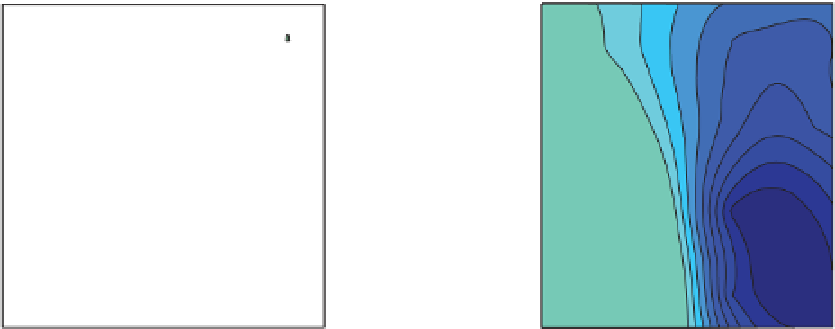
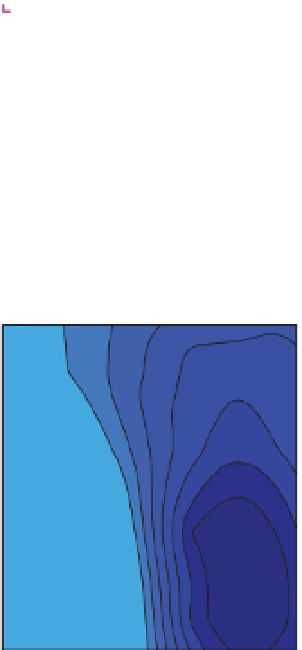
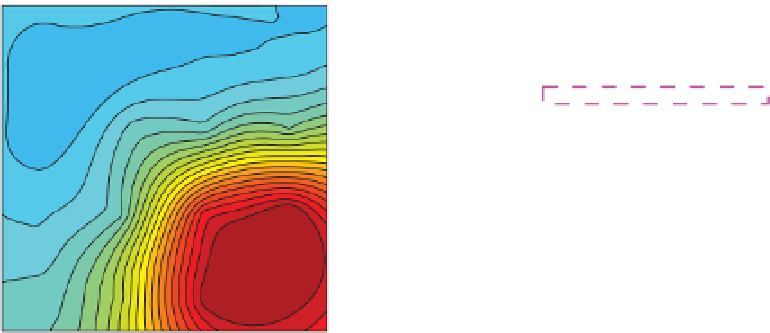
Figure 5.19
Self-potential spatial voltage distributions of Events E2 and E3.
a)
and
b)
Event E2 voltage distribution showing the
peak voltage associated with the second hydraulic pulse during constant flow injection. Note the voltage polarities in the spatial
distributions and the color bar voltage scale (+2.5 to
2.0 mV). Event E2 represents the first of a series of electrical field bursts. Panels
a)
and
b)
show a reversal in polarity and increase in peak magnitude relative to figure panels
c)
and
d)
.
c)
and
d)
Event E3
spatial voltage distribution showing the peak voltage associated with the highest magnitude pulse during constant flow injection.
(
See insert for color representation of the figure
.)
−
events. First, a brief pressure drop (E1p), seen in
Figure 5.20 just before the E1 peak, indicates some sort
of pulse flow of fluid occurred, which may have led up
to the E1 peak. The following reversal of polarity that
peaks at E2 is correlated with another pressure drop
(Figure 5.20; E2p) just prior to the peak at E2. This indi-
cates that the initial fluid flow direction at E1 was in a
downward direction, possibly an indication of the initial
downward direction of a plastic failure in the epoxy seal
before the reversal of flow direction due to other seal fail-
ures with higher volumes and mostly vertical flow direc-
tions. It is possible that the impulsive nature of these
progressive seal failure events was unique to this partic-
ular epoxy seal technique that caused a plastic seal
failure. Additionally, gas pockets inside the epoxy inter-
face with the hole wall could be an explanation of the
burst nature of the seal failure. This could have been
caused by unequal distribution of the epoxy along the
hole wall. The rupture of each gas pocket would produce
a drop in pressure followed by an increase in the fluid
flow along the hole wall, resulting in an electrokinetic
response. As we will show later, the direction of the cur-
rent density corresponding to Event E2 is mostly pointing
upward and grows in magnitude in an impulsive manner