Geoscience Reference
In-Depth Information
Offset and trend removed full data set time series - 0 s to 2086 s
30
T0
Phase 0
Phase I
Phase II
T1
T2
b)
20
10
0
−10
0
130
260
390
520
650
780
910
1040
1170
1300
1430
1560
1690
1820
1950
2080
(a)
Time (s)
Offset and trend removed time series - 1790 s to 2086 s
20
T2
E3
c)
10
0
−10
2030
2050
2070
(b)
1790
1810
1830
1850
1870
1890
1910
1930
1950
1970
1990
2010
Time (s)
Time series from 1805 s to 1820 s
6
E0
E1
E2
4
d)
2
0
−2
−4
(c)
1805
1806
1807
1808
1809
1810
1811
1812
1813
1814
1815
1816
1817
1818
1819
1820
Time (s)
Time series from 1805 s to 1809 s
0.3
0.2
E0
E1
0.1
0
−0.1
−0.2
−0.3
1805
1806
1807
1808
1809
(d)
Time (s)
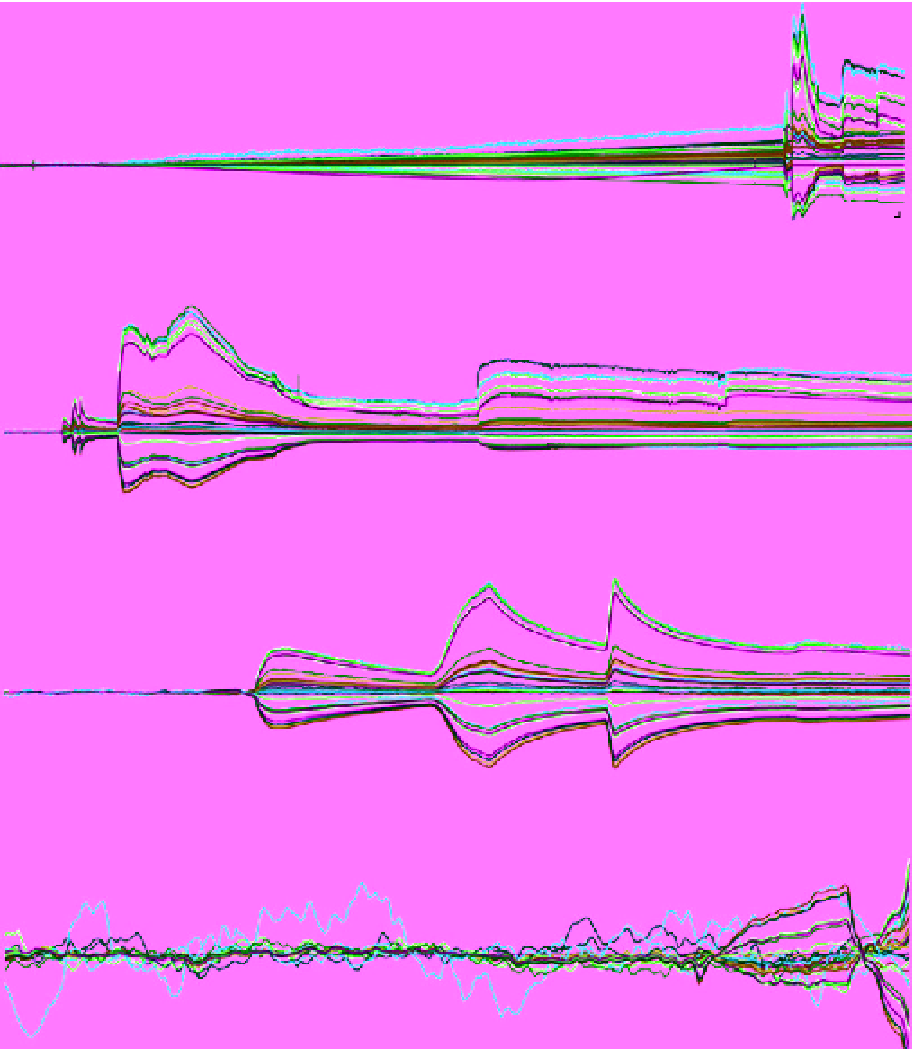
Figure 5.17
Self-potential time series related to Hole #9 saline water injection.
a)
Full time series data set showing the different
fluid injection time periods during data acquisition (T0, T1, and T2). Note the significant change in electrical response after T2 that
is bounded by region
b)
.
b)
Zoom highlighting the background normalized electrical response showing distinct electrical
impulses related to the start of constant flow injection at T2 with selected peak events.
c)
Zoom in region
c)
highlighting the first series of
impulsive signals with selected peak Events E2, E3, and E4 with temporal reference to E0 and E1.
d)
Zoom in region
d)
showing the temporal noise leading up to Event E1, with a voltage background time slice at E0. Note the change in
potential after E1. (
See insert for color representation of the figure
.)