Geoscience Reference
In-Depth Information
0.20
True focal mechanism
0.15
N
0.10
0.05
P
0
−2
−1.5
−1
−0.5
0
0.5
1
1.5
2
M
xx
0.25
0.20
0.15
Inverted focal mechanism
0.10
N
0.05
0
−2
−1.5
−1
−0.5
0
0.5
1
1.5
2
M
zz
P
0.20
0.15
0.10
0.05
0
−2
−1.5
−1
−0.5
0
0.5
1
1.5
2
M
xz
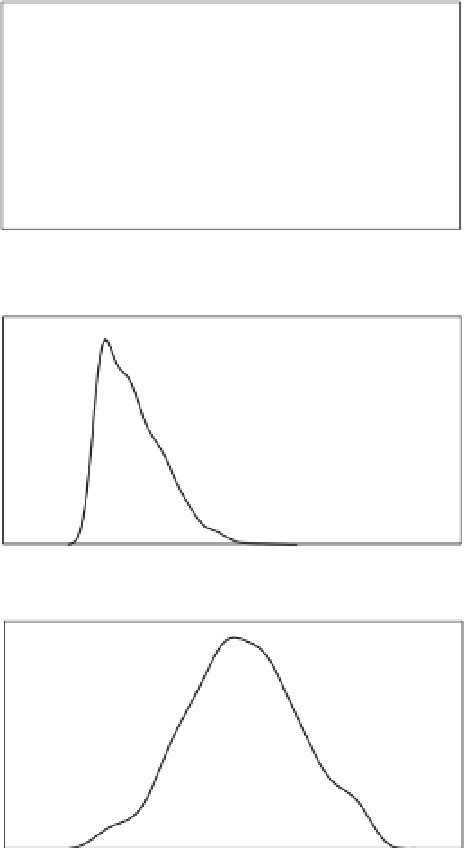
Figure 5.13
Probability density functions of the three components of the moment tensor determined from the AMA where the
thickness of the first layer and the position of the source was determined from the tomographic approach of Figure 5.12
. We also show
the true focal mechanism and inverted focal mechanism with the highest likelihood.
seismic source. We then applied the same algorithms to
the potential distributions for two subsequent times for
which the source current densities are generated in the
first Fresnel zone of the interface separating L1 and L2.
Again, the algorithm is able to locate the source of cur-
rent at the correct position along the interface. There-
fore, this type of analysis can be successful in locating
the source and the position of the heterogeneities in
the system.
Once the thickness of the first layer and the position
of the source have been determined from the electrical
data using the deterministic, gradient-based algorithm
presented earlier, we can switch to the AMA to deter-
mine the probability densities of the different compo-
nents of the seismic source tensor. Again, we used the
AMA with 1000 realizations. The posterior probability
densities for the three components of the moment tensor
are shown in Figure 5.13: we see that the peaks of the