Geoscience Reference
In-Depth Information
Horizontal seismic displacement Ux ( ×10
-6
m)
Vertical seismic displacement Uz ( ×10
-6
m)
Time source
Time source
1
0
1
2
0
P-S
P
P-S
ST01
P
ST01
S
S
-2
2
0
-2
2
0
-2
2
0
-2
ST02
ST02
2
0
-2
ST03
ST03
2
0
-2
2
0
-2
2
0
-2
2
0
-2
P-S
P
P-S
ST04
ST04
P
S
S
ST05
ST05
1
0
-1
2
0
2
ST06
ST06
1
0
1
2
2
0
ST07
P
S
ST07
P-S
-2
2
0
-2
ST08
ST08
0
-2
0
0.1
0.2
0.3
0.4
0.5
0.6
0.7
0.8
0.9
1.0
0
0.1
0.2
0.3
0.4
0.5
0.6
0.7
0.8
0.9
1.0
Time (s)
Time (s)
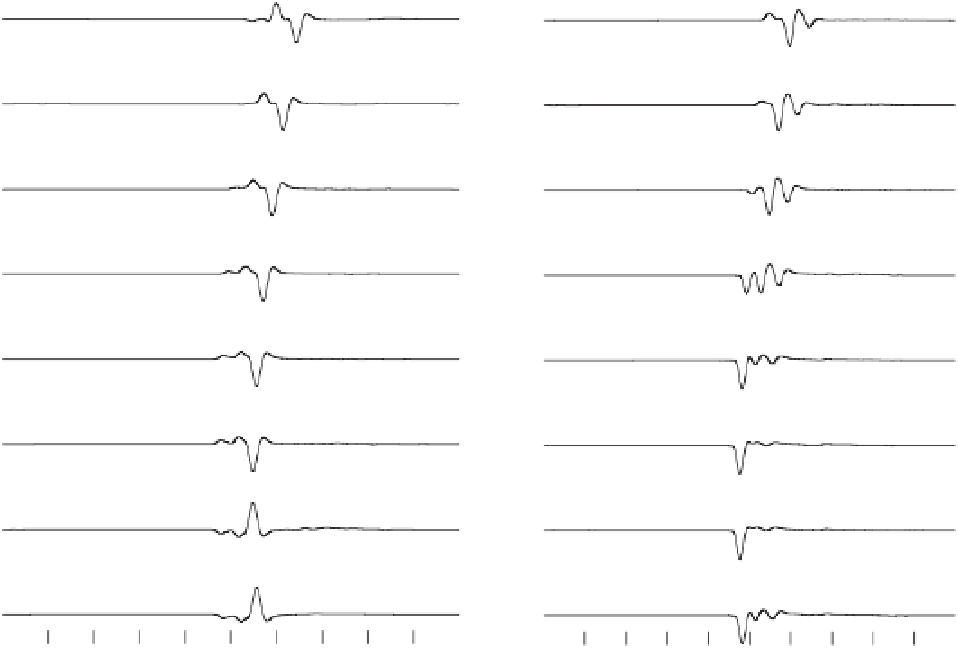
Figure 5.5
Horizontal and vertical seismic displacements responses. We can observe (i) some signals that are created from the
mechanical P
-
S conversion mechanism at the interface (P
-
S conversion) and (ii) the P
-
P- and S
-
S-waves. The S
-
P interfacial signal is
not visible on these time series because of the minimum radiation pattern of S
-
P-wave in (
x
-
z
) plane for horizontal and vertical
components of the seismic displacement.
From these time series, we can observe the direct field
(type I electrical disturbance), which occurs at the same
time as the seismic source (
t
s
= 0.15 s). This direct electrical
field is shown simultaneously at the eight stations.
The seismoelectric conversion (type II) is observed at
t
=
0.22 s when the wave arrives at the interface between
the two layers. This seismoelectric disturbance is also
observed simultaneously at the eight stations. For both
type I and type II anomalies, the diffusion of the electro-
magnetic information is so fast that the signals are seen
nearly instantaneously at all receivers. The coseismic
(type III) electrical disturbance is observed at various times
due to geometrical spreading of the seismic waves. This
includes the P- and S-waves and also the converted P
and L2. Following Snell
'
slawandwavepropagation
theory, the S
-
P coseismic response is dominant at the
region
the sourcemidpoint because L2 has a higher
velocity compared with L1. This contrast causes the
S-wave to have less transmissivity at the interface and,
in the process, switches all its incidence energy into the
critically reflected wave along the L1
“
near
”
L2 interface (Stein
& Wysession, 2003). In other words, the farther from
the source that the conversion point is located along the
interface, the smaller the S
-
P coseismic wave amplitude
will be. From these synthetic data, we show that the elec-
trograms contain much more information than the seis-
mograms alone. The information content of the seismic
and electrical data can be appraised by using a stochastic
framework as shown in the next section of this paper.
-
-
S-
and S
-
P-waves generated at the interface between L1