Biology Reference
In-Depth Information
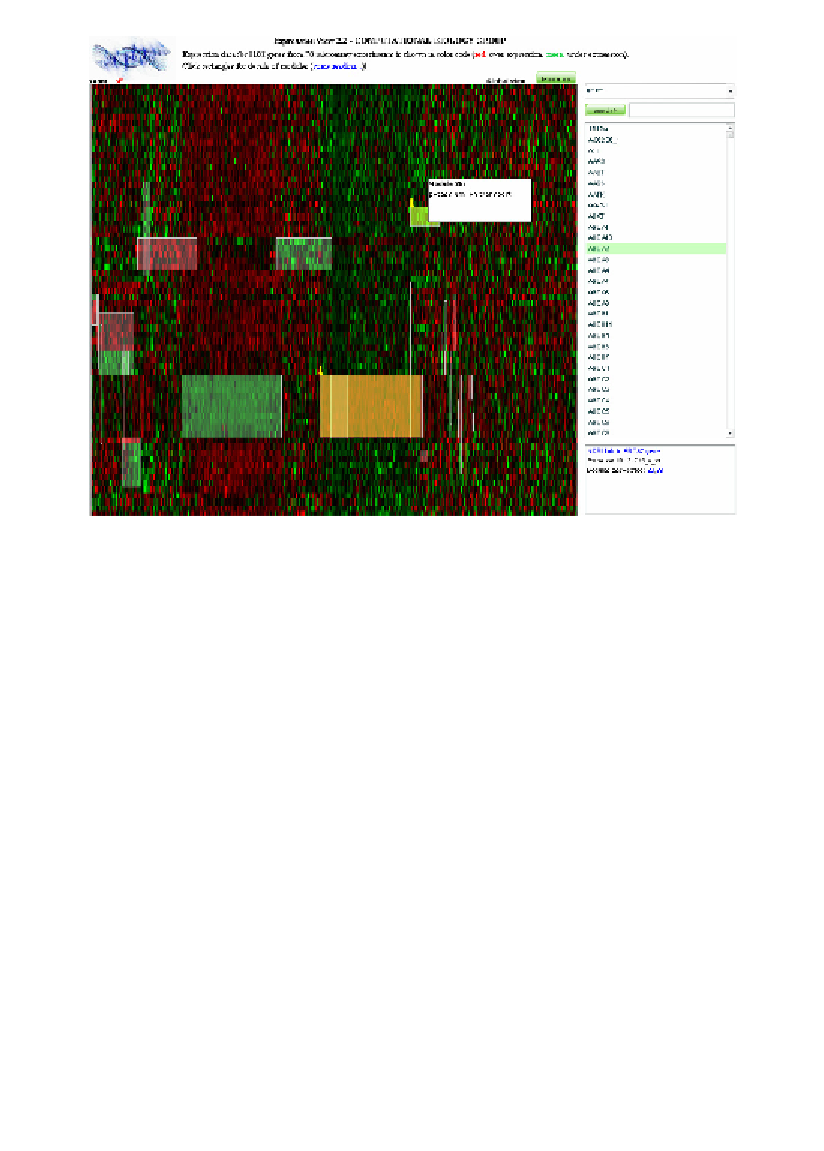
Fig. 7.
Screenshot from the prototype of ExpressionView (available online at
http://serverdgm.unil.ch/bergmann/ExpressionView.html). Similar to the standard
biclustering, our tool visualizes the expression levels of all genes in the dataset
(columns) under many experimental conditions (rows) using a color code. Yet, the
order of genes and conditions has been optimized in order to highlight coherent
expression patterns that are apparent only over a subset of the entire dataset (i.e. tran-
scription modules). Genes (as well as conditions or modules) can be selected in the
window on the right. Modules are clickable, providing detailed information on their
genes and conditions, as well as automated annotation in terms of enriched GO
categories and KEGG pathways.
provide insights into dynamic relationships. For example, studying
gene expression data from baker's yeast revealed that genes involved
in stress response are usually suppressed when genes involved in pro-
tein synthesis are induced, and vice versa.
7,69
This reflects a fundamen-
tal strategy of the yeast's transcription program to invest the available
resources either to grow or to survive. For higher organisms, whose
survival chances do not depend on the ability of its cells to outgrow
others, but rather on their proper coordination, this strategy is probably