Biology Reference
In-Depth Information
(a)
(b)
compare correlation patterns
between genes
differential clustering algorithm
(DCA)
1
combine PCMs
genes
pairwise
correlation
matrix
CA
conditions
PCM A
C.alb
PCM
A
pairwise
correlation
matrix
SC
S.cer
PCM B
PCM
B
conditions
genes
primary structure:
cluster & arrange by
reference
B
secondary structure:
re-arrange within
each cluster by
A
classify conservation
pattern of each cluster
2
3
4
cluster1
PCM
A
PC
A
C
a
C
ab
C
b
C
g
PCM
B
PCM
B
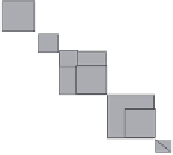
Fig. 5. (
a
)
Pairwise correlation matrices (PCMs) are calculated from the expres-
sion data in each organism. (b) The PCMs are combined into a single matrix,
where each triangle corresponds to one of the PCMs (1). The genes are then
ordered in two steps: First, genes are clustered and the PCMs are rearranged
according to the correlations in the reference organism (“B”) (2). Second, the
genes assigned to each of the resulting primary clusters are reclustered according
to their correlations in the target organism “A” (secondary clustering) (3). Finally,
the conservation patterns of each cluster are classified automatically into one of the
four conservation classes (4).
depicts the correlations in the target organism (Fig. 5(b)). Inspection of
the rearranged composite PCM allows for an intuitive extraction of the
differences and similarities in the coexpression pattern of the two organ-
isms. Specifically, the PCM is clustered and each primary cluster is
subdivided into two secondary clusters
a
and
b
, and characterized by
three correlation values corresponding to the average correlations of
genes within (
C
a
,
C
b
<
C
a
) and between (
C
ab
) these subclusters. An auto-
matic scoring method is then applied to classify clusters into one of four