Biology Reference
In-Depth Information
A
T
-2
t
2
B
T
-1
t
1
T
0
C
D
E
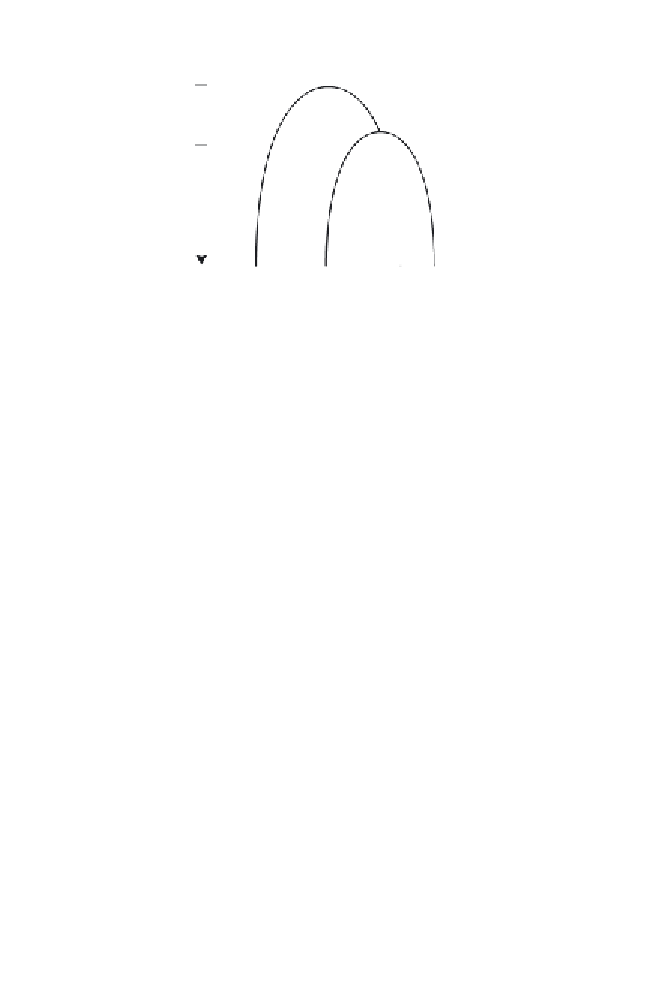
Fig. 7.
A tree graph with the direction of time indicated. C, D, and E are present-
day taxa, while A and B are ancestral forms.
T
−1
and
T
−2
are the points in time where
branching took place, while
T
0
is the present time.
t
1
and
t
2
represent the length of
time between the branching event at B and present day and the length of time
between the branching event at A and the branching event at B, respectively.
insignificant in most cases (notable exceptions include viruses and bacte-
ria). Transfer of genetic information is thus practically always “vertical”.
This verticality is what allows the reconstruction of an entire tree despite
only the terminal taxa being known — if it were not for this property,
there would not be enough structural constraints on the available data
for tree reconstitution.
4.2. Numerical Taxonomic Phenetics (NTP)
Numerical taxonomic phenetics (NTP) methods, also called taxometry
methods, start with the calculation of pairwise dissimilarities between
taxons. The matrix of character states is converted into a semimatrix of
dissimilarities
D
ij
.
n
Rudimentary clustering methods such as UPGMA (Unweighted Pair
Group Method using Arithmetic averages) simply cluster taxons on the
basis of their similarity to each other. No phylogenetic hypotheses —
such as the possibility of homoplasy — enter into these methods. Even
so, some of them, for example WPGMA (Weighted Pair Group Method
n
Obviously,
D
ij
=
D
ji
and
D
jj
=
0.