Biology Reference
In-Depth Information
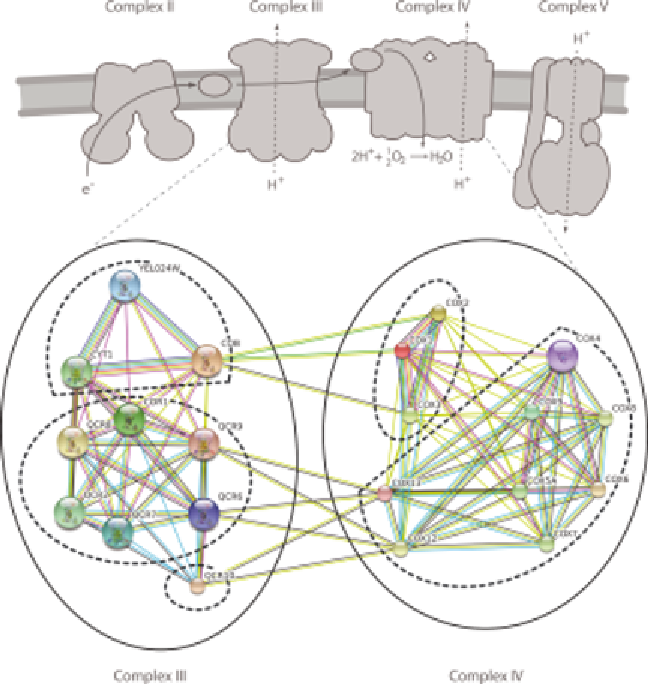
Fig. 1.
Unsupervised clustering of a protein-protein association network. A subset
of the proteins making up the electron transfer chain of yeast mitochondria is shown
in an association network (a schematic overview of the entire transfer chain is shown
above; illustration modified from the KEGG database). The association network is
from the STRING database (http://string.uzh.ch/, version 7.1). The proteins are
seen connected both within and across the two complexes. The line color indicates
the type of evidence supporting a functional link: green lines, conserved genomic
neighborhood; red lines, gene fusion events; blue lines, co-occurrence across
genomes; dark gray lines, similarity in expression regulation; pink lines, experimental
interaction evidence; cyan lines, already annotated in common pathway/complex;
and bright green lines, mentioned together in the scientific literature. Unsupervised
clustering (
K
-means) was applied at two-different cut-offs. With a low-stringency