Biology Reference
In-Depth Information
the frequency of individuals, as fragments were dominated by hermaphrodite in-
dividuals (61.05±15.33%), whereas non-hermaphrodite systems were prevalent
(50.12±10.66%) among individuals of the control plots. Particularly expressive,
as well, was the lower representation of monoecious individuals in the fragments-
more than 12-times lower (1.72±1.84%) than control plots (24.51±13.92%)
(Figure 3B). Fragments also had a slight but statistically significant decrease in
the proportion of self-incompatible and overall obligatory outcrossing species
(self-incompatible+dioecious; Table 2). In terms of the relative abundance of tree
species within categories of reproductive system, fragments had significant lower
scores of outcrossing individuals (87.82±6.84% vs. 95.40±8.54 in control plots)
and highest frequency of self-compatible ones (11.59±6.56% vs. 3.90±8.03 in
control sites) (Figure 3C).
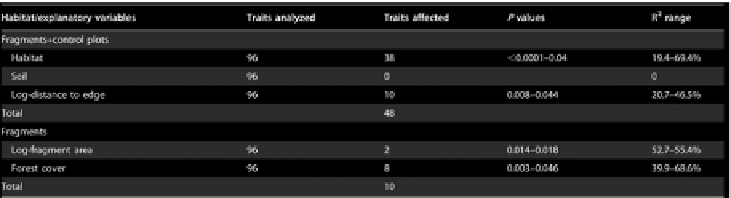
Explanatory Variables
GLMs did not reveal any significant influence of soil type on the proportion
of traits in tree assemblages. Habitat was consistently the strongest explanatory
variable for the proportion of tree species and individuals within categories of
reproductive traits, explaining between 19.4% and 69.4% of their variation, in-
fluencing 38 categories (Table 3). GLMs also detected 10 categories of reproduc-
tive traits that were influenced by log-distance to edge (considering forest frag-
ments and control plots), two categories influenced by log-fragment area, and
eight affected by forest cover (considering forest fragments only) (Table 3). These
three fragmentation-related variables explained between 20.7% and 68.6% of the
variation on reproductive traits in forest fragments and control plots (Table 3).
Additionally, ANOSIM revealed no significant correlation between soil type and
level of taxonomic similarity between plots (R = 0.024; P = 0.54), but detected a
stronger effect of habitat type (R = 0.95; P = 0.001). A Mantel test failed to un-
cover any spatial effects on the taxonomic similarity among plots (Rho = 0.155;
P = 0.9).
Table 3.
Scores from General Linear Models applied to the proportion of tree species and individuals within
categories of reproductive traits (48 categories for species, 48 categories for individuals) in forest fragments (N =
10) and control plots (N = 10) in a fragmented landscape of Atlantic forest, northeastern Brazil.