Biology Reference
In-Depth Information
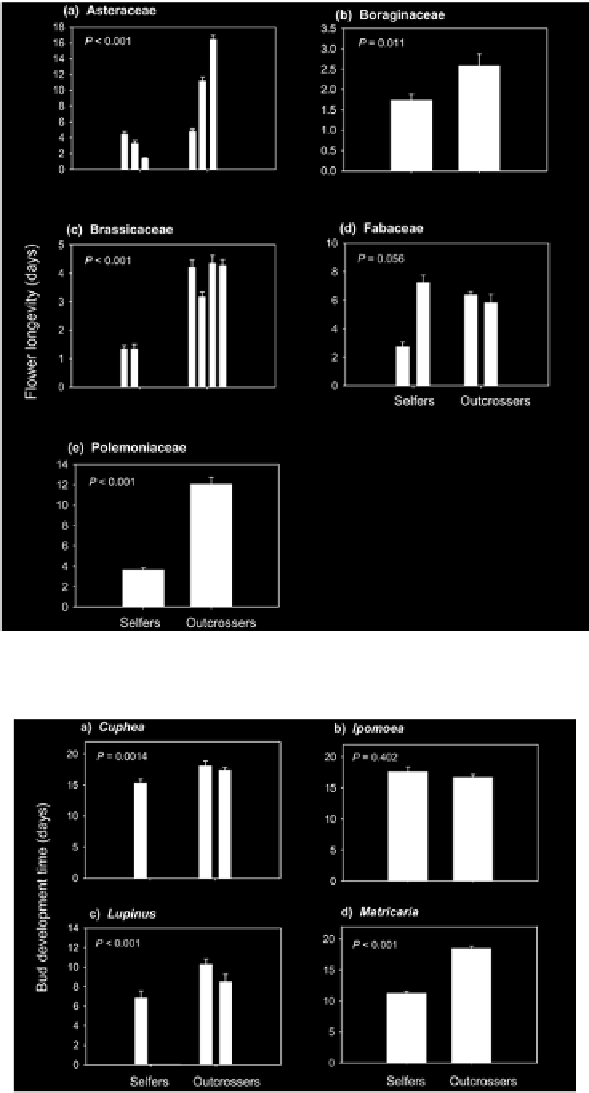
Figure 4.
Mean (SE) flower longevity for selfing and outcrossing species within each of 5 families. For each
species, n = 4 or 5. P - values are from ANOVA.
Figure 5.
Mean (SE) bud development time for selfing and outcrossing species within each of 4 genus pairs. For
each species, n = 4 or 5. P - values are from ANOVA.