Environmental Engineering Reference
In-Depth Information
1980
1981
1982
1988
1.1
20
20
20
20
5
5
5
5
15
15
15
15
10
10
10
10
1.3
19
19
19
19
9
9
9
9
14
14
14
14
4
3
4
3
4
3
4
3
8
13
8
13
8
13
8
13
1.5
12
12
12
12
18
18
18
18
2
2
2
2
17
16
17
16
17
16
17
16
1.7
7
7
7
7
1
1
1
1
6
6
6
6
11
11
11
11
1.9
0
0.5 1.0 1.5 2.0
0
0.5 1.0 1.5 2.0
0
0.5 1.0 1.5 2.0
0
0.5 1.0 1.5 2.0
Cattle (no. ha
-1
)
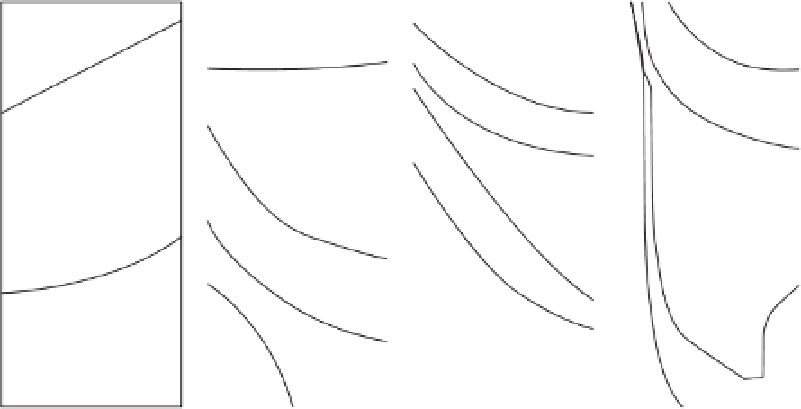
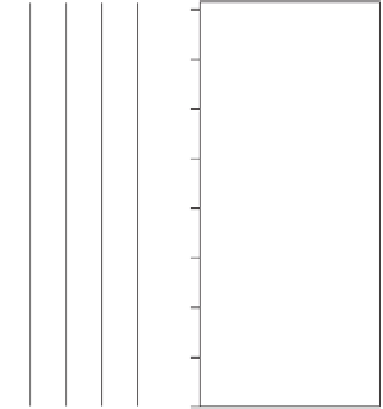
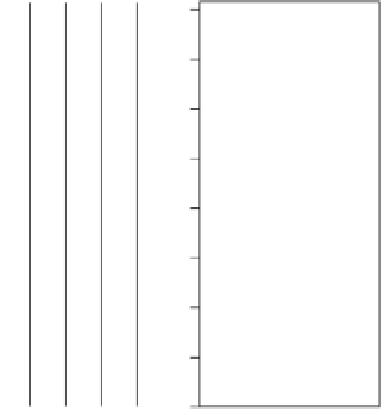
Figure 19.3
Changes of the invertebrate fauna along an elevational gradient (ordnance datum) by cluster analysis of 20
pitfalls for the different stocking rates installed in 1980 and continued during subsequent years on the salt marsh of Leybucht,
Germany. The darkest colour indicates non-halobiontic communities. (Modifi ed from Andresen
et al
. 1990 .)
n
=
26
21
25
13
to restoration efforts. Moreover, with the past decade
Open Marsh Water Management
has been widely prac-
tised using biological control, which favours small fi sh
to control mosquitos and simultaneously promotes res-
toration (Niering 1997).
South American (Costa
et al
. 2009 ) and Australasian
(Thomson
et al
. 2009) coastal salt marshes have a
natural
geomorphology
. They are not intersected
with an intensive ditching system. The main human
impact is heavy exploitation. The effect of intensive
livestock grazing, resulting in short swards and possi-
ble erosion, in combination with drought is regarded
as a disturbance.
10
a
8
a
6
ab
4
2
b
0
intensively
grazed
extensively
grazed
short-term
ungrazed
long-term
ungrazed
Grazing regime
19.4 RESTORATION OF
SEMINATURAL SALT MARSHES
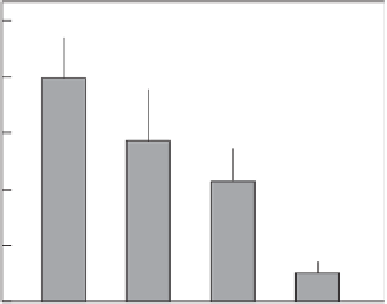
Figure 19.4
Average goose - grazing pressure at transects
in the entire Wadden Sea from the seawall to the intertidal
fl ats in relation to livestock-grazing regime for all transects
that were paired within the same site. Different letters
indicate signifi cant differences (
P
< 0.05). (Modifi ed from
Bos
et al
. 2005 .)
19.4.1 Targets for restoration
of salt marshes
A list of structural attributes that best indicate the
status of restored salt marshes was given by Zedler and
Lindig - Cisneros (2000) : (1) vegetation structure:
species composition, stem densitiy, percent cover and
biomass or total stem length are probably the most