Agriculture Reference
In-Depth Information
Task 1
Task 2
Capital
∂
h
∂
h
∂
h
∂
k
∂
t
∂
t
2
1
max
r
1
∂
h
1
∂
h
t
2
∂
2
∂
t
1
2
w
min
w
r
t
F
k*
k
F
F
t
k
t
1
t
2
t
t
1
2
2
1
Panel (a): The Family Farm
Task 1
Task 2
Capital
∂
h
h
∂
h
∂
∂
k
t
t
∂
∂
2
1
max
r
1
∂
h
1
∂
h
P
r
2
t
2
∂
∂
t
1
2
min
w
r
w
t
t
k
F
P
k*
k
P
P
k
t
1
t
2
t
t
2
1
1
2
Panel (b): Two-Farmer Partnership
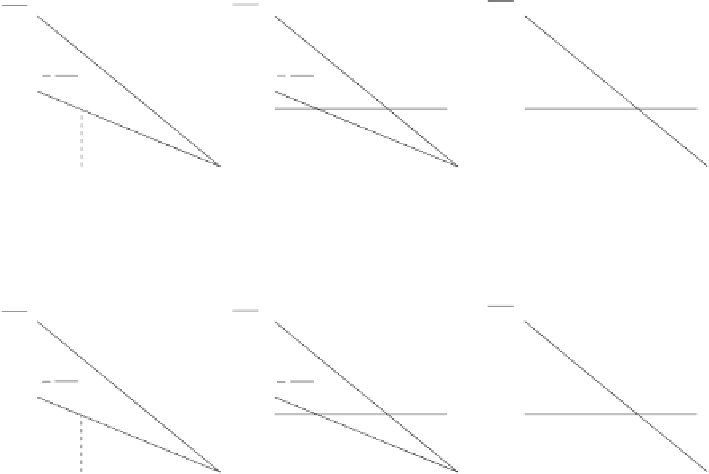
Figure 9.1
The trade-off between specialization and moral hazard
Figure 9.1 shows the trade-off involved in the choice between a family farm and a
partnership farm. The figure shows the optimal allocations of effort and capital in each
farm organization in the simplest case when (a) there are only two tasks and two partners
(so
in a partnership); (b) there is one stage-specific type of capital; (c) capital and
effort are independent inputs; and (d)
N
=
T
1. As with all our graphs, we have drawn linear
marginal products for added simplicity. For comparison, we show the first-best input levels,
denoted by asterisks. Panel (a) shows the case of the family farm. Since there is just one
farmer (
α
=
N
=
1) and two tasks (
T
=
2), the marginal product rotates downward by one-half,
t
1
t
2
and the optimal task choices are
and
. Given the higher cost of capital, the family
k
F
units of capital. Panel (b) shows the case of a two-farmer partnership where
there are still only two tasks. Under the assumptions used in figure 9.1, the specialization
and moral hazard effects exactly offset each other.
13
As a result, allocation of task effort
is identical in the two regimes, but because of lower capital costs, the partnership is more
valuable. It is easy to see, however, that if the potential gains from specialization decline
farm uses