Geography Reference
In-Depth Information
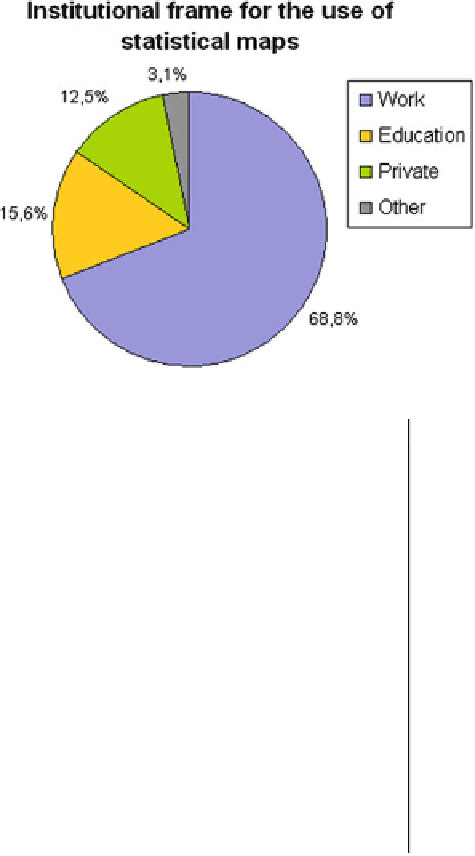
Fig. 3 Institutional
backgrounds of users of
statistical maps
Table 1 User groups of
statistical maps and atlases in
the professional and
educational sector
a
User group by profession
Share
University students
23.8 %
Journalists
12.0 %
Administration employees
7.5 %
Publishing companies employees
7.4 %
Teachers
7.1 %
Scientists: geographers
5.5 %
NGOs and other organization employees
5.2 %
Politicians
5.0 %
Statisticians
4.4 %
Students, pupils
3.6 %
Cartographers
2.8 %
Employers, Businesses
2.5 %
Planners, Engineers
2.2 %
Private businesses employees
1.9 %
Scientists: others
1.1 %
Others
7.7 %
a
Based on a survey of 873 client contacts at FSO
s Cartography
'
Unit (ThemaKart) during the years 2003-2013
publishers are integrated thereafter in school topics, text books or other teaching
material. Another large user group is formed by professions that are officially
engaged with questions around the status of the administration or the society:
administration employees, statisticians and politicians (together 17 %). Not unex-
pectedly large is also the interest from the media. Journals, newspapers and TV
broadcasters love statistical charts and maps to illustrate their stories, e.g. after
election days, demographic problems or economic crises.


