Geography Reference
In-Depth Information
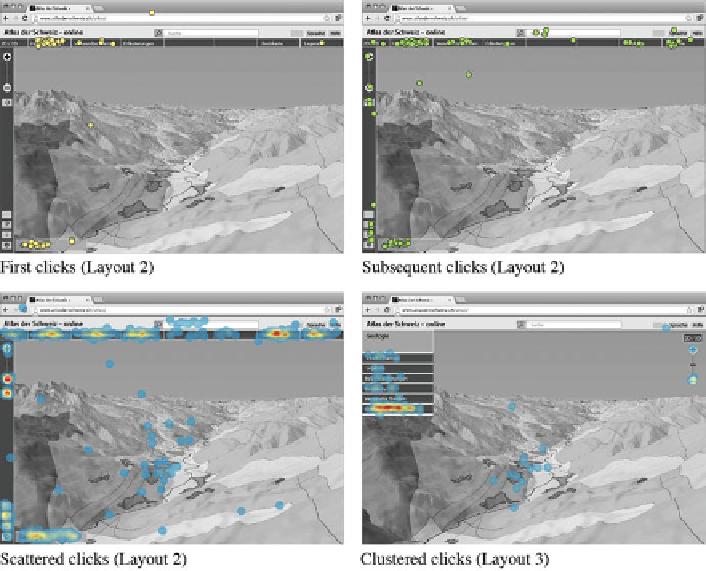
Fig. 2
Top:
Separation of first clicks (
left
) from further clicks (
right
). Participants were asked to
change the map theme in Layout 2.
Bottom:
Different small mouse-click hotspots (marked with
blue-yellow-red colors, red being the most dense) in Layout 2 (
left
) and one large hotspot in
Layout 3 (
right
) become apparent on a surface density map. Students were asked to get an
overview of the given map extent
Further exploration of click maps and surface density maps revealed different
interaction patterns for each layout. In the following section, the most remarkable
findings are summarized for each task.
Aggregated for all layouts, 90 % of answers were correct for the
first task
.Tobe
able to solve this task, participants had to change the map theme between geology
and raw materials in a list. The list was already open in Layout 4 and 5 or appeared
when clicking on a button labeled
in Layout 2 and 3. In Layout
1, the list opened when clicking on the map title. Interestingly, 29 % of students,
who were faced with Layout 2 for the first time (so being unbiased by the other
layouts), expected the map title to be interactive (Fig.
2
, top). Approximately one
fifth (21 %) of the students clicked at least once into the search box in one of the
layouts for this task, however this functionality was not implemented.
For the
second task,
the participants had to discover the meaning of thematic
colors (gray shades) on the map and this was possible only by clicking on a button
labeled
Content/Theme
'
'
Legend
or in the legend itself. This task was completed successfully in
'
'