Geography Reference
In-Depth Information
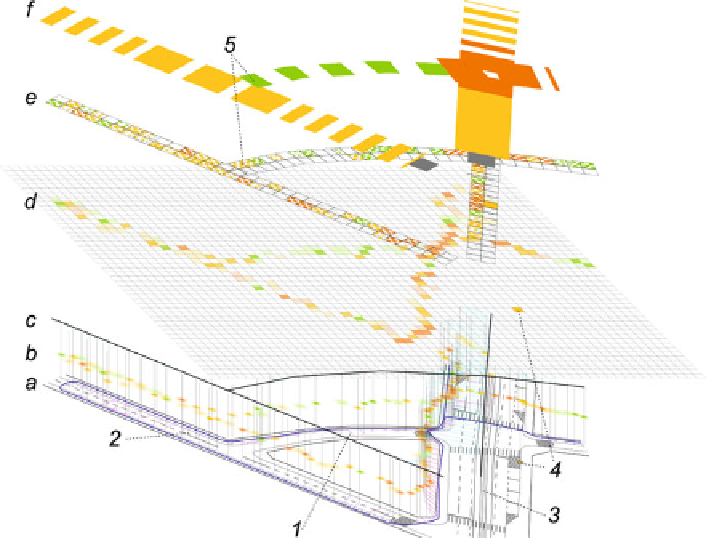
Fig. 2 Derivation of urban traffic noise map from the string of noise point data collected by
mobile phone with GPS. Description in text
color hue and color value, and measurement uncertainty [on Fig.
2(b)
excluding
positional uncertainty] can be represented by blurred edges.
It should be noted, that difference between original position of measured points
and model street lines [depicted by
cyan vectors
on Fig.
2(c)
] may not be correlated
with GPS measurement error.
Today, a relatively large effort has been directed to uncertainty visualization and
interpretation in the map. A large number of methods have been developed (see
MacEachren
1995
). However, only a few of these methods have been tested for
(1) how they really influence the perception of the user, and (2) which of those
methods are most effective.
Evans (
1997
) compared four basic methods for displaying uncertainties on
choropleth maps. She found that best results of uncertainty interpretation are still
achieved on bivariate maps and on maps with user uncontrolled animations.
According to her, users do not use uncertainty information from the map, located
next to the map of a particular phenomenon, because such comparison are too
laborious.
Normal processing of noise map is done on a regular cell network [grid, see
Fig.
2(d)
]. For sufficiently accurate processing, this raster must have relatively large
number of cells. Cartographic visualization of the overall measurement uncertainty
on the grid is usually represented by transparency, but, on a light background,