Geography Reference
In-Depth Information
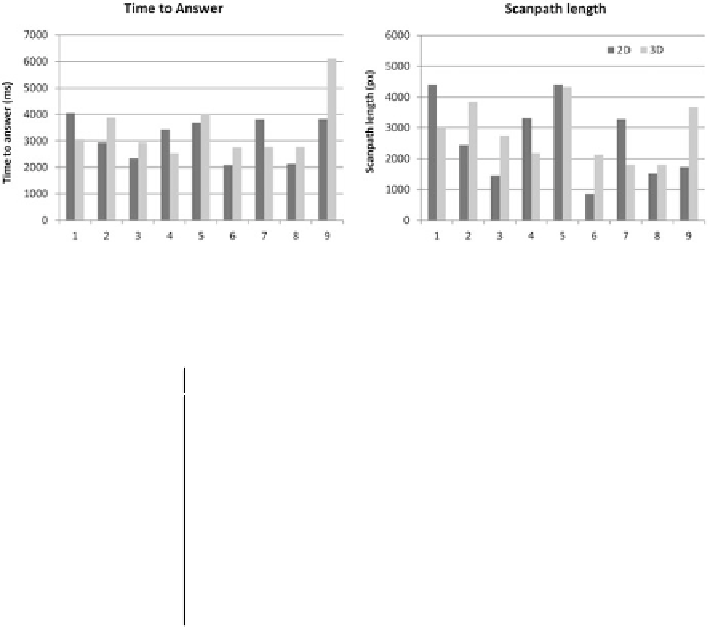
Fig. 2 Graph of median time to answer (
left
) and scanpath length (
right
) values for each map in
the experiment
Table 1 Wilcoxon test of differences between fixation count for 2D and 3D variant of the map
Fixation count
Alpha
W
p-value
Statement
Map 1
0.05
1,070
0.009296
Rejecting H0
Map 2
0.05
565
0.02381
Rejecting H0
Map 3
0.05
505
0.004499
Rejecting H0
Map 4
0.05
1,011
0.04238
Rejecting H0
Map 5
0.05
745.5
0.6027
Failed to reject
Map 6
0.05
498.5
0.003702
Rejecting H0
Map 7
0.05
1,035.5
0.02351
Rejecting H0
Map 8
0.05
722.5
0.4575
Failed to reject
Map 9
0.05
482.5
0.002266
Rejecting H0
In case of Time to Answer metric (Fig.
2
, left), highest difference between 2D
and 3D variant was observed for map 9. This result was expected, because the 3D
map no. 9 is tilted and orientation in this map is harder. Second highest value of
Time to Answer was recorded in case of 3D variant of map 5. This map, which
displays the downtown of New York with many 3D skyscrapers, is the most
complex one from the set of “Google maps (map 1-5)”. It is surprising that the
difference between 2D and 3D variant is so small in this case.
Value of Time to Answer is interlinked with the Fixation Count metric (see
Table
1
), where statistically significant difference was observed for 7 from 9 maps.
In contrast to Fixation Count, statistically significant difference for Fixation Dura-
tion Median was observed only in three cases (Map 5, 7 and 9).
According to Goldberg et al. (
2002
), a longer scanpath indicates less efficient
searching. Statistically significant difference was found in 5 cases from 9 (Fig.
2
,
right). For maps 1 and 7, higher median scanpath length was recorded for 2D
variant. For maps 3, 6 and 9, higher values were recorded for 3D variant. This fact
suggests that the scanpath length was dependent on other variable than 2D or 3D
visualization method.