Geography Reference
In-Depth Information
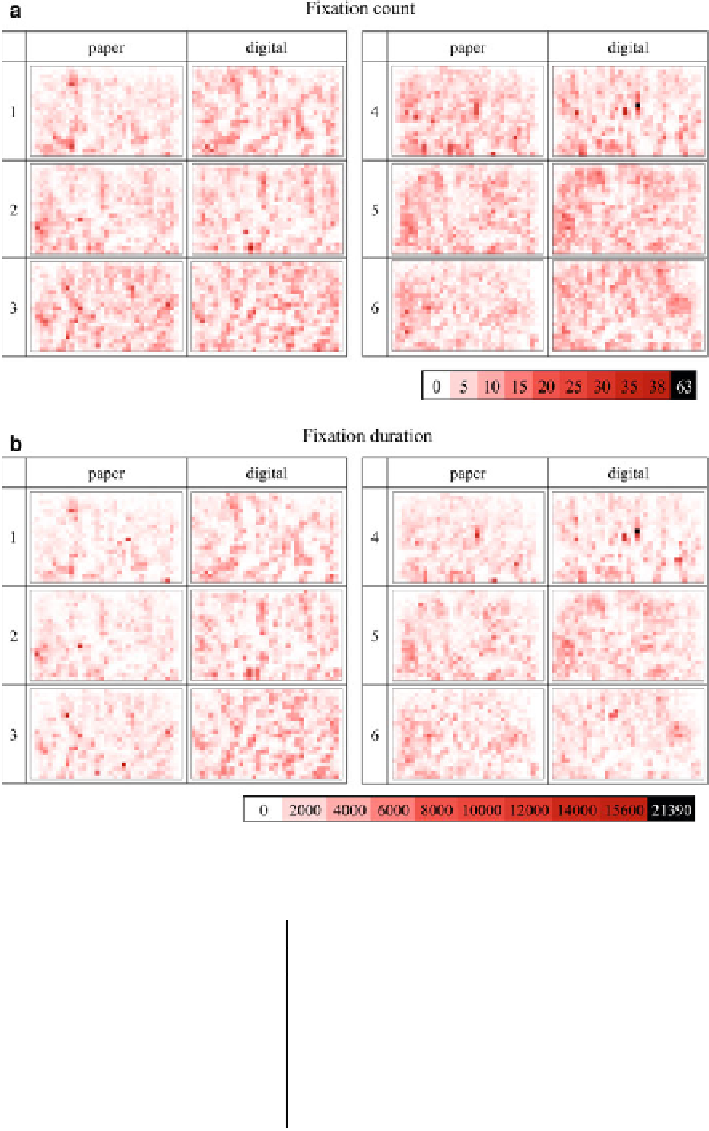
Fig. 2 Gridded visualisation: distribution of the users
'
fixation counts (a) and fixation duration (b)
on the twelve stimuli
Table 6 Mean fixation
duration (with standard
deviation) for the twelve
stimuli
Paper
Digital
Mean (ms)
SD (ms)
Mean (ms)
SD (ms)
1
225.701
87.085
254.941
32.264
2
275.485
40.275
248.760
36.465
3
261.438
48.541
271.314
46.700
4
273.458
37.491
248.316
32.265
5
258.505
34.533
272.113
29.772
6
274.327
34.863
248.099
25.925