Geography Reference
In-Depth Information
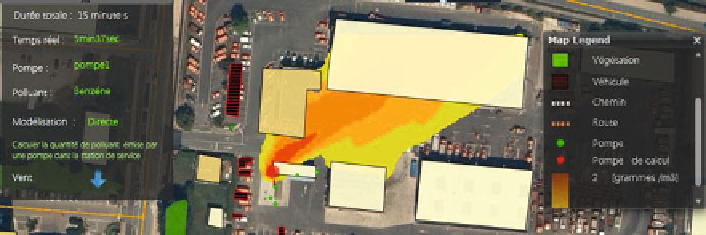
Fig. 2 Web services to view Benzene propagation around a gasoline station from fictive measures
generated several files as the phenomenon varied in time. There was one file for
each computed time. Each file was then modified to integrate three constraints:
• the beginning of the file was modified to follow exactly a DTM format,
• a translation was integrated to respect a geographical reference system (Lambert
93),
• Values were analysed and normalised.
We name this result a DPM: a
digital phenomenon model
. A phenomenon which
lasts a certain duration is symbolised by a set of DPMs.
These DPMs, qualified by specific information (see third section), are stored in a
data base, named the
pollution data base
. Figure
1b
, compared with Fig.
1a
,
illustrates the changes we had to make to easily map the pollution on top of
geographical information extracted from the IGN-France BDTopo
.
A classical architecture based on PostGis, GeoServer, WMS and WFS was set to
view the DPMs on top of Geographical data from IGN-France (BDtopo and
Orthophotographies) (Boukhechba
2013
). Figure
2
illustrates the result which can
also be accessed on
http://representation-phenomenes.ifsttar.fr
;
In the following we present data models to map and explore the data.
©
Data Models to Map Pollution Data in 2D
Figure
1b
illustrates the data flow to map the pollution field by means of DPMs. It
requires a data model illustrated in Fig.
3a
. We also present a second data model
(Fig.
3b
) which allows more possibilities.
The core of the model is the
Pollution Episode
. The pollution episode is the
description of the phenomenon at a specific date and during certain duration. It is
computed by means of measures of pollution and wind and a model, parameterised
in a specific way. The maximum and the minimum episode values are useful for the
symbolisation (
categorisation method
).