Geography Reference
In-Depth Information
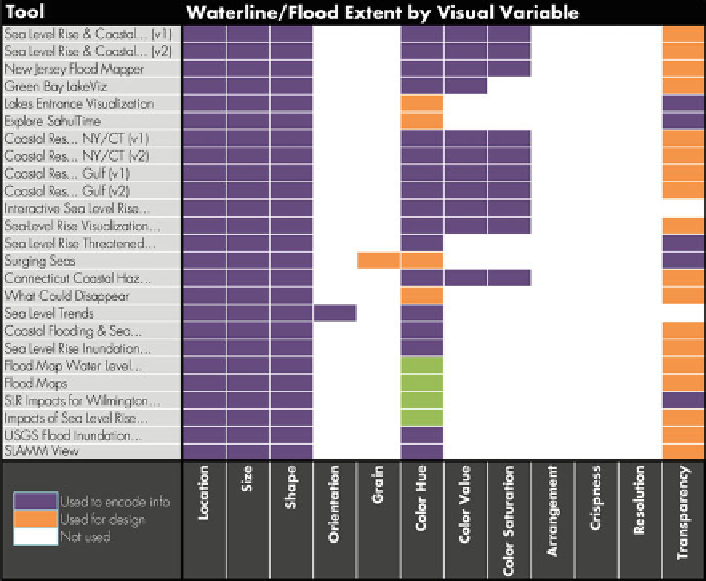
Fig. 2 Waterline/Flood Extent by Visual Variable
Results
Representation of the Waterline/Flood Extent
Given the emphasis of the competitive analysis on water level visualization tools,
we first analyzed the way in which the waterline or flood extent is represented
across the tools. Graphic representations signify information by leveraging one or
several
visual variables
, or basic buildings blocks of the visual scene (Bertin
1967
-
1983). Commonly employed visual variables for vector-based signification include:
location, size, shape, orientation, grain, color hue, color value, color saturation,
arrangement, crispness, resolution, and transparency. Figure
2
provides an over-
view of the waterline/flood extent representation by visual variable.
The competitive analysis revealed that the visual variable location (25/25;
100 %) is used across all tools to represent the location of the waterline and the
visual variables size (25/25; 100 %) and shape (24/25; 96 %) are used to represent
the flood extent in all or most tools. The ubiquitous use of size and shape to
represent the flood extent suggests that existing tools highlight not the predicted
position of the waterline, but the areas that will be flooded as a result of the shifting