Geography Reference
In-Depth Information
that are geographically close to each other (there are only few exceptions). The
average length of connections somewhat increases on the map of connections with
LLR weights between 6-7 or 5-6, while it seems much larger on the map of
connections with LLR weights between 4-5. The map with LLR weights over
7 looks much clearer due to short distance of relations than those having smaller
LLR weights but longer lines. We should note, however, that the number of ties is
also increasing when stepping on lower LLR weight levels: there are only 2,281
connections, which have LLR weights over 7, 3,951 connections have LLR weights
between 6-7, 8,917 connections have LLR weights between 5-6 and 19,819
connections have LLR weights between 4-5.
It is also observable (both on Figs.
3
and
4
) that the highest LLR weights are
primarily perceptible in western and south-western parts of the country (in West-
Transdanubia and South-Transdanubia regions), as well as among northern settle-
ments (in the region of North-Hungary). These regions are basically typified by
small sized settlements, and it is also observable that the largest LLR weights are
first of all connected to small settlements (even to very tiny ones). It additionally
reflects that small settlements, or more precisely settlements with the highest LLR
weights, have only connections with very few other settlements, therefore the
chance that two settlements are (relatively) very strongly connected is rather
high. Two small settlements could be very tightly related to each other in the
log-normalized network space of iWiW.
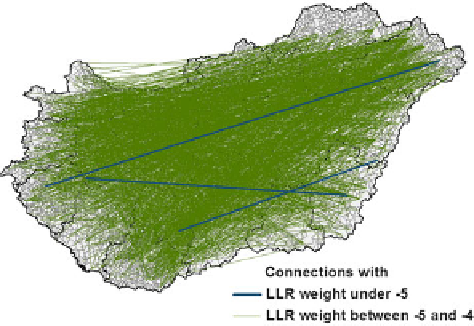
On the other hand there are of course weak connections in the network as well,
which stand for ties between settlements with the lowest number of friendships. By
drawing the map of the weakest settlement-to-settlement links with the lowest local
log-likelihood ratio weights, very distant relations appear (Fig.
5
). The map of
extreme weak connections reflect that basically settlements, which are located very
far form each other, are having very few number of acquaintance. In our dataset
there were 1,529 connections under the LLR weight of
4.0, of them 3 were even
under
5. The result map shows this time hardly visible spatial pattern of connec-
tions, or rather a haystack of lines.
Fig. 5 The weakest
settlement-to-settlement
connections (with the
lowest LLR weights)