Geography Reference
In-Depth Information
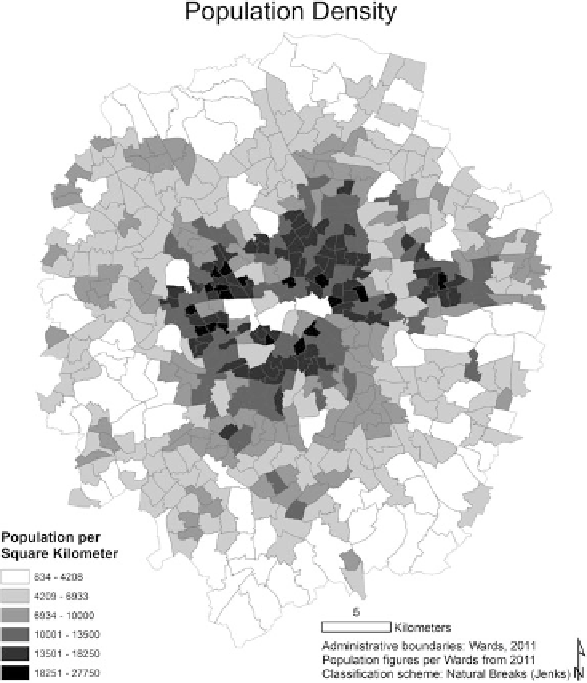
Fig. 4 Population density map for the study area
surrounding wards have a high level of commercial, touristic and work activities
(Adnan and Longley
2013
), which could explain the overrepresentation of tweet
counts in that area. The explanation of hotspots in the East and North-East is less
intuitive. Therefore, the subsequent step of the analysis investigates socio-
demographic characteristics of hotspots. The objective is to understand whether
population demographics explain the tweet hotspots.
A parallel coordinate plot of socio-demographic variables is shown in Fig.
5
.
Red and orange lines represent tweet hotspots. Visual exploration of the plot
suggests that tweet hotspots tend to share similar characteristics especially regard-
ing the percentage of inhabitants in working age (16 and 64 years), the qualification
and access to public transportation. Tweet hotspots seem to be characterized by a
large percentage of people in working age and a low percentage of people over
65 years. A substantial percentage of the population has a qualification of level
4, which corresponds to at least a Bachelor
s degree. The fraction of inhabitants
without qualification tends to be lower in tweet hotspots. However,
'
there is