Biomedical Engineering Reference
In-Depth Information
sonogram
acoustic
pressure
amplitude
p
k
f
0
0.0
time (s)
2.0
k
k
k
k
p
p
p
p
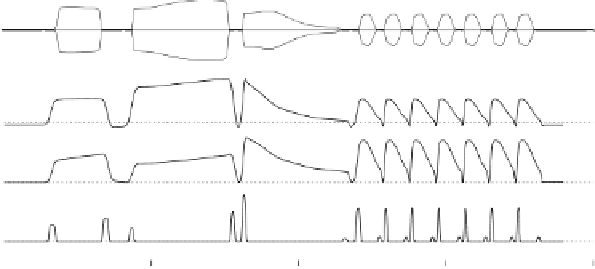
Fig. 5.8.
In order to reproduce the song of the chingolo sparrow, we had to generate
paths in the parameter space, which we illustrate in this figure. The sonogram of
the synthetic song is shown in the first panel. The next panel shows the synthetic
acoustic pressure predicted by the simple model. The panels below this one display
the values of pressure, restitution constant and
f
0
that had to be used in order to
drive the model so it could reproduce the desired song. The last panels show the
trajectories of the parameters
p
and
k
used in our simulations in a
p
,
k
parameter
space. The
dashed lines
correspond to pieces of the trajectories in which the labia are
not allowed to oscillate owing to the additional force
f
0
. The ellipses are traversed
counterclockwise (modified after [Laje et al. 2002])
the recorded song with the synthetic song that was produced from the elec-
tromyographic (EMG) data that had been recorded [Mindlin et al. 2003].
The air sac pressure was recorded with a flexible cannula inserted into the
anterior thoracic air sac and connected to a piezoresistive pressure transducer.
The muscle activity was recorded with wire electrodes which were implanted
into the syringeal muscles. These wires were made of stainless steel and were
secured to the tissue with a microdrop of tissue adhesive. After the implan-
tation of the microelectrodes, the wires were led out and routed to the back,
and then the air sac was closed. Details of these procedures were published
in [Goller and Suthers 1996a]. The data used in the experiments designed to
test the model were simultaneous records of song, air sac pressure, dTB ac-
tivity and vS activity. The data were taken from two cardinals (
Cardinalis
cardinalis
).