Chemistry Reference
In-Depth Information
Fig. 3 Solid-state NMR
structure of membrane bound
potassium channel KcsA-
Kv1.3. Adapted from [
7
] with
permission from Nature
Publishing Group
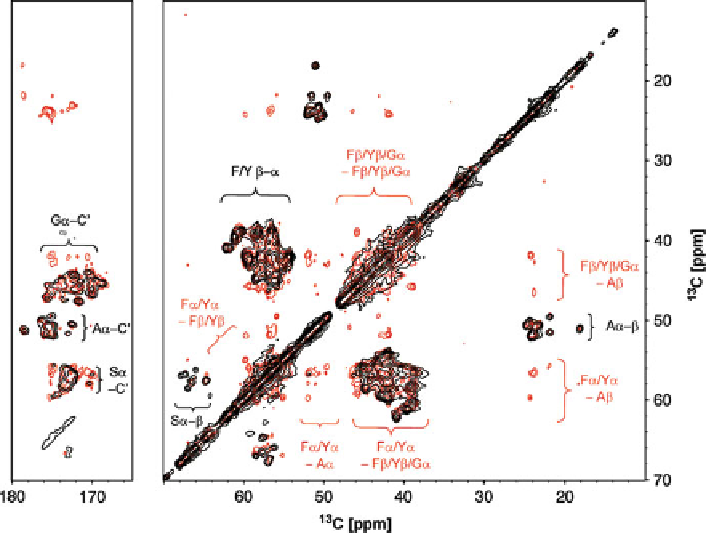
Fig. 4
13
C-
13
C proton-driven spin diffusion spectrum of OmpG-GAFY recorded at 900 MHz
with 20 ms (
black
) and 700 ms (
red
) mixing time. Intra- (
black
) and inter-residual (
red
) cross-peak
regions are indicated. Adapted from [
49
] with permission from the American Chemical Society
using [
15
N, 2, 3-
13
C]-labeled Phe and Tyr residues and fully labeled Gly and Ala
residues to restore favorable cross-relaxation properties of the glycerol samples in
order to obtain inter-residue cross-peaks [
49
]. They have expressed the 281-residue
OmpG with this labeling strategy (referred to as OmpG-GAFY) and demonstrated
its advantage by the
13
C-
13
C proton-driven spin diffusion (PDSD) experiment [
127
,
191
-
192
] as shown in Fig.
4
. It is very clear that the Ca-Cb signals for Phe, Tyr, and
Ala, and the Ca-C' cross-peaks for Gly and Ala are all well resolved and the signal
intensities are increased significantly [
49
]. This labeling scheme has several