Chemistry Reference
In-Depth Information
, and
R
2
. In the group fits, the
p
a
and
k
ex
are assumed to be uniform in
the group, while
p
a
,
k
ex
,
do
/2
p
and
R
2
are assumed to be residue specific. The total number
of parameters in a group fit is therefore equal to 2 + 2
m
(
m
is the number of
residues, as described in (5)). As described below, there are variations in the
number of parameters depending on the models and the kinds of experimental
data applied for the analysis.
In the individual fit, there are a couple of practical points for better optimization.
To explain it, the following simplified fast-exchange (
6
) and slow-exchange (
7
)[
97
,
98
,
116
] are useful (Fig.
4
):
do
/2
p
2
k
ex
=ð
2
R
2
þ
k
ex
þð
R
2
¼
p
a
p
b
ðdoÞ
2
pn
CP
Þ
Þ
(6)
R
2
¼
R
a
0
2
þ
p
b
k
ex
p
a
k
ex
f
sin
ðdo=
4
n
CP
Þ=ðdo=
4
n
CP
Þg:
(7)
First, as seen in (
6
)and(
7
), the parameters are not independent of each other. For
example, in the fast-exchange regime (
6
),
p
a
and
are not independently determined
from one relaxation dispersion profile (Fig.
4a
). In such a fit for each
R
2
dispersion
profile, the
p
a
p
b
(
do
)
2
term is given as a single term,
F
ex
,andthe
k
ex
is determined [
132
,
133
]. In particular, these parameters are extracted from an analysis of
R
1
r
, in which a
strong
B
1
field strength is applied and exchange is therefore assumed to be in the fast
limit. In the slow exchange, (
do
n
CP
) term is not separated (Fig.
4b
). Moreover, since
the dispersion profiles in the fast and slow exchanges are similar [
134
], the simplified
equations for each time scale may be used when the time scale of exchange has been
estimated by other experiments. Second, since the parameters are not such
do
/4
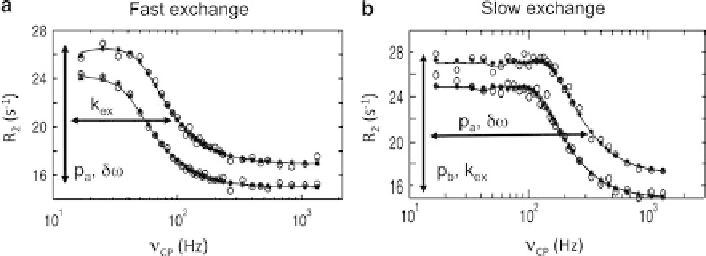
Fig. 4 Generated (a) fast-exchange and (b) slow-exchange
R
2
dispersion data (
open circles
)with1%
intensity noise, and their data points obtained by fit (
asterisks
), and the fit curve (
solid lines
). In (a), the
noisy data points were generated assuming a two-site exchange with the following parameters:
p
a
100 s
1
,
15 s
1
at 61 MHz. In (b), the noisy data points
were generated assuming a two-site exchangewith the following parameters:
p
a
¼
0.9,
k
ex
¼
do
/2
p ¼
60 Hz, and
R
2
¼
100 s
1
,
¼
0.9,
k
ex
¼
15 s
1
at 61 MHz. In both cases, the two sets of data with the noise were
generated assuming 61 and 81 MHz. The fit data points were slightly different from the fit curves
because of the noise. The
vertical
and
horizontal bars
and parameters besides indicate the parameters
that determine magnitudes of
R
ex
and the effective field strength,
do
/2
p ¼
200 Hz, and
R
2
¼
n
CP
, respectively