Biology Reference
In-Depth Information
Major
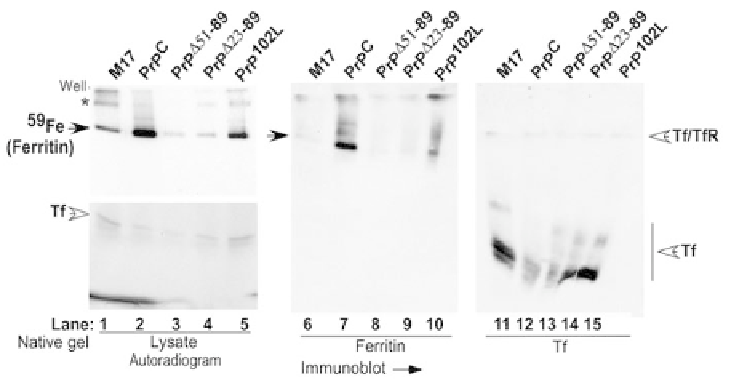
59
Fe labeled proteins in these cells were identifi ed by separating cell lysates
prepared in non-denaturing buffer on a 3-20% native gel in duplicate. One part of
the gel was dried and subjected to autoradiography (Figure 2, lanes 1-5), while the
other was transferred to a PVDF membrane under native conditions and probed for
ferritin and Tf using specifi c antibodies [19, 20] (Figure 2, lanes 6-15). Autoradiogra-
phy shows a prominent iron labeled band consistent with ferritin (Figure 2, lanes 1-5
and 6-10, black arrow), and a faster migrating band representing Tf (Figure 2, lanes
1-5 and 11-15, open arrow) (the lower part of the autoradiograph is over-exposed to
highlight the Tf band). Compared to M17 lysates, the amount of
59
Fe bound to ferritin
is higher in PrP
C
and PrP
102L
lysates, and lower in PrP
Δ51-89
and PrP
Δ23-89
lysates (Figure
2, lanes 1-5). On the other hand, Tf bound iron is higher in M17 compared to PrP
C
,
PrP
Δ51-89
, and PrP
Δ23-89
lysates, and equivalent to PrP
102L
lysates (Figure 2, lanes 1-5
and 11-15). The slower migrating iron labeled bands (*) probably represent a complex
of Tf and TfR (Figure 2, lanes 1-5) [20, 21]. Probing for ferritin shows a major band
and minor slower migrating forms probably representing ferritin complexes (Figure 2,
lanes 6-10, black arrow). Probing for Tf shows oligomers or glycosylation variants of
Tf that correspond to
59
Fe labeled purifi ed transferrin fractionated similarly (Figure 2,
lanes 1-5, 11-15). The relative levels of ferritin and Tf proteins in the samples corre-
spond to radioactive iron in labeled ferritin and Tf bands in all samples (Figure 2, lanes
1-15). Similar results were obtained when the cells were labeled with
59
FeCl
3
-citrate
complex for 16 hr or with purifi ed
59
Fe-Tf for 4 and 16 hr (data not shown), indicat-
ing similar uptake of non-transferrin and Tf bound Fe by these cells. Silver staining
of re-hydrated autoradiographed gel confi rms equal loading of protein for all samples
analyzed. Quantitative comparison of ferritin iron and levels of PrP, ferritin, and Tf
between the cell lines is shown below in Figure 4.
Figure 2.
The PrP influences iron incorporation in cellular ferritin. Radiolabeled lysates were
fractionated on a 3-20% native gradient gel in duplicate. One set was subjected to autoradiography
(lanes 1-5) and the other was transblotted and probed for ferritin and transferrin under native
conditions (lanes 6-15).