Database Reference
In-Depth Information
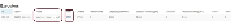
The Storm UI provides a very rich interface where the user can start from a very high
level and drill down deeper in specific areas, as you can see in the screenshot in
The
Storm cluster setup
section where we discussed the Storm cluster level attributes; in the
second level, we moved to a specific topology. Next, within a topology, you can click on
any bolt or worker and the component level details will be presented to you. One item as
highlighted in the following screenshot is of high importance for debugging and log deci-
phering in cluster setup—the worker ID. If some component spout or bolt is giving us is-
sues and we want to understand the working, the first place to look is the logs. To be able
to look at logs, one needs to know where the troublesome bolt is executing which supervi-
sor and which worker; this can be inferred by drilling on that component and looking into
the executor section as follows:
The Storm UI capturing the supervisor port
Here, the host tells you which supervisor this component is running on and the port tells
you about the worker, so if I want to look for logs of this component, I will look into
lo-
gdir
for
sup-flm-dev-1.mydomain.net
in the log directory under
work-
er-6711.log
.
Search WWH ::

Custom Search