Database Reference
In-Depth Information
•
Complete latency
(
ms
): This is the average total time taken by a tuple to execute
throughout the topology.
•
Acked
: This holds the number of events acked that are successfully processed.
•
Failed
: This is the number of events that failed to process successfully.
Section 4
This section is the same as
Section 3
, the only difference being that here, the terms are dis-
played at a component level, that is spouts and bolts, while in
Section 3
, it was at the topo-
logy level. There are a few more terms on the UI that you should be introduced to. They
are as follows:
•
Capacity
: This is one of the most important metrics to look at when fine-tuning
the topology. It indicates the percentage of time the bolt spent in the last ten
minutes to execute the tuple. Any value close to one or above is an indication to
increase the parallelism of this bolt. It's calculated using the following formula:
Capacity = (Number of tuples Executed*Average
execute latency)/Window_Size*1000)
•
Execute latency
: This is the average time a tuple spends in the execute method of
the bolt during processing.
•
Process latency
: Process latency is the average time it takes from when the tuple
is received by the bolt to the time when it's acked (acknowledged to denote suc-
cessful processing).
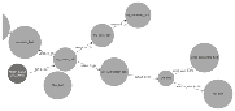
The visualization section
One of the improvements in Storm 0.9.2 is visual depiction of the topology. The following
figure is the depiction of a sample topology in the Storm UI:
In the preceding screenshot, you can see all the streams visually labeled by various bolts
and spouts on the topology along with latency and other key attributes.
Search WWH ::

Custom Search