Information Technology Reference
In-Depth Information
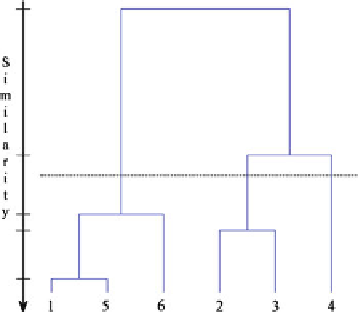
Fig. 1.5
A dendrogram
example
distance that measures the distance between groups of data or data distributions.
These probabilistic distance measures use the complete information about the
structure of the classes provided by the conditional densities. Thus, the measure
distance, J, satisfies the conditions: (i) J
¼
0 if the probability density functions
are identical, p
ð
x
j
w
1
Þ¼
p
ð
x
j
w
2
Þ
; (ii) J
0; and (iii) J attains its maximum when
the classes are disjoint, i.e., when p
ð
x
j
w
1
Þ¼
0 and p
ð
x
j
w
1
Þ 6¼
0. Some of the
probabilistic distances are: average separation, Chernoff, Bhattacharyya, and the
Kullback-Leibler (KL) divergence D
KL
. This last distance is defined as [
38
]
D
KL
¼
Z
q
ð
S
;
W
=
X
Þ
p
ð
S
;
W
=
X
Þ
dWdS
q
ð
S
;
W
=
X
Þ
log
ð
1
:
8
Þ
where X is the set of available mixture data and S is the respective source vectors.
W denotes all the unknown parameters of the mixture data model; p
ð
S
;
W
=
X
Þ
denotes the posterior pdf for the reference model, and q
ð
S
;
W
=
X
Þ
denotes the
posterior probability density function for the estimated model. We used D
KL
as
similarity measure for merging clusters in a proposed hierarchical clustering
algorithm for ICA mixtures that is included in
Chap. 4
.
Most hierarchical clustering algorithms are variants of the so-called single-link
and complete-link algorithms. These algorithms differ in the way that they char-
acterize the similarity between a pair of clusters. In the single-link algorithm, the
distance between two clusters is the minimum of the distances between all pairs of
data drawn from the two clusters, whereas in the complete-link algorithm, this
distance is the maximum of all pairwise distances. In either case, two clusters are
merged to form a larger cluster based on minimum distance criteria. The complete-
link algorithm yields more compacted clusters than those obtained by the single-
link algorithm. This latter technique suffers from a chaining effect, so it has a
tendency to produce clusters that are straggly or elongated [
39
].
As stated above, the result of the hierarchical clustering algorithm is a tree of
clusters, called a dendrogram, which shows how the clusters are related. The hier-
archical levels of the dendrogram can be formed in two different schemes:
agglomerative (from the bottom to the upper part of the tree) and divisive (from the
Search WWH ::

Custom Search