Information Technology Reference
In-Depth Information
Digital data transmission
(USB bus)
Data acquisition
setup
(RS232 bus)
Data acquisition
equipment
Analog data
transmission
(coaxial cable,
BNC connector)
CONTROL
Ultrasound
equipment
Storage box:
cables, sensors,
connectors, etc.
Mobilization
Ultrasound
transducers
Fig. 6.7
Ultrasound equipment
(a)
(b)
Signal is
attenuated
Air h
Multiple reflections
are produced giving
a higher signal level
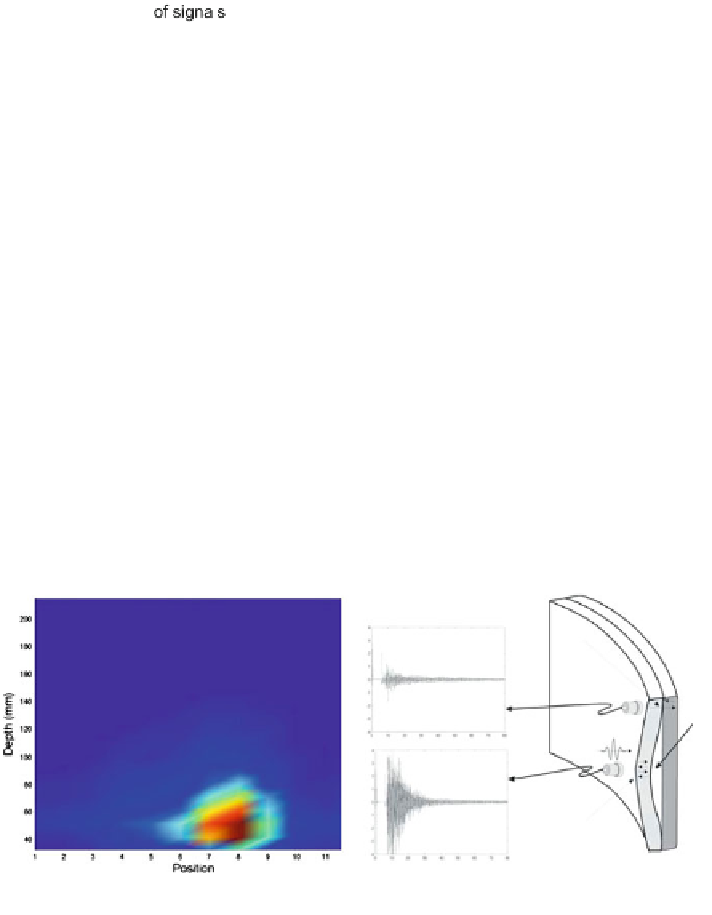
Fig. 6.8
Power signal B-Scan by non-stationary analysis a Power B-Scan b Scheme of the wall
From the spectral analysis, two frequencies (181 and 356 kHz) were found in all
the recorded signals. After estimating the B-Scan of Fig.
6.8
, the origin of the
sinusoidal frequencies was not clear enough; they could be interferences or
material resonances. Then we applied ICA to obtain more information from the
mixture matrix and recovered sources. Figure
6.9
shows the recorded signals and


Search WWH ::

Custom Search