Information Technology Reference
In-Depth Information
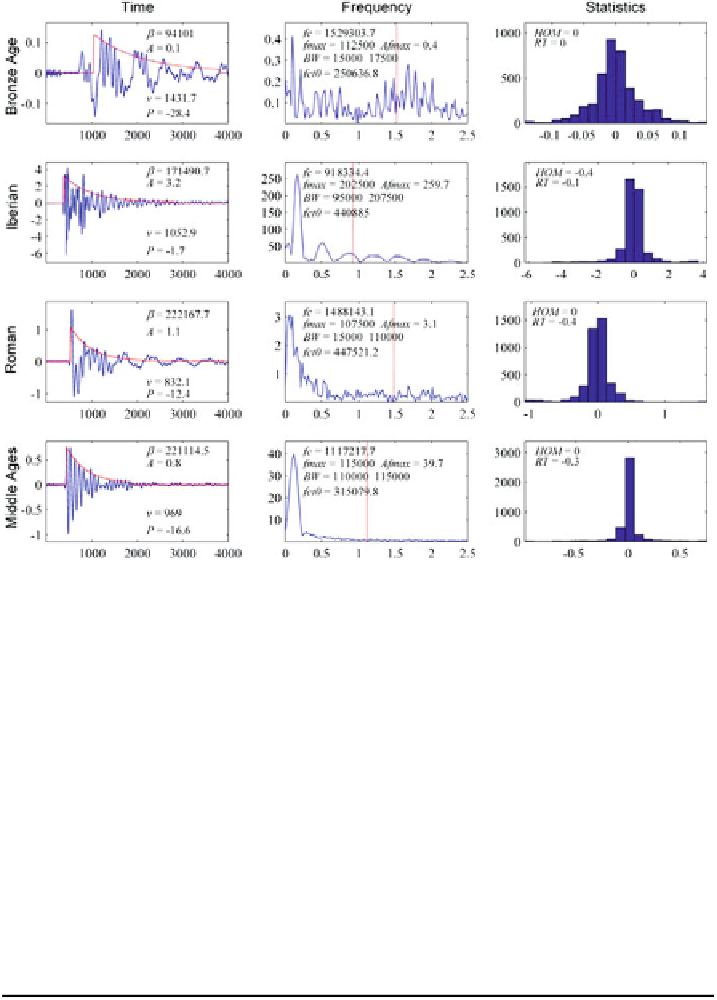
Fig. 6.4 Some examples of time signals, spectra, histograms and corresponding features
extracted from ultrasonic signals for archaeological ceramic pieces from different periods. Units
are: Time axis: sample number; Frequency axis : MHz; Statistics axis: bins of signal values;
P [dB]; v [m/s]; fc, fmax, BW, fct0 [Hz]
Table 6.1
Classification accuracy (percentage) obtained with the different variants of Mixca
PSS ratio
Mixca
Mixca-JADE
Mixca-TDSEP
Mixca-FastIca
1
0.83
0.81
0.79
0.81
0.8
0.79
0.75
0.69
0.71
0.6
0.72
0.67
0.66
0.60
0.4
0.65
0.64
0.55
0.59
Table 6.2
Classification accuracy (percentage) obtained with the other methods
LDA
RBF
LVQ
MLP
kNN
0.73
0.64
0.59
0.67
0.64
To gain more insight into the classifier performance, we include Table
6.3
,
which contains the confusion matrix obtained by Mixca for 1 PSS ratio. The
Roman and Iberian categories are not very difficult to classify, but they are often
confused with each other. The pieces from the Middle Ages are confused with


Search WWH ::

Custom Search