Environmental Engineering Reference
In-Depth Information
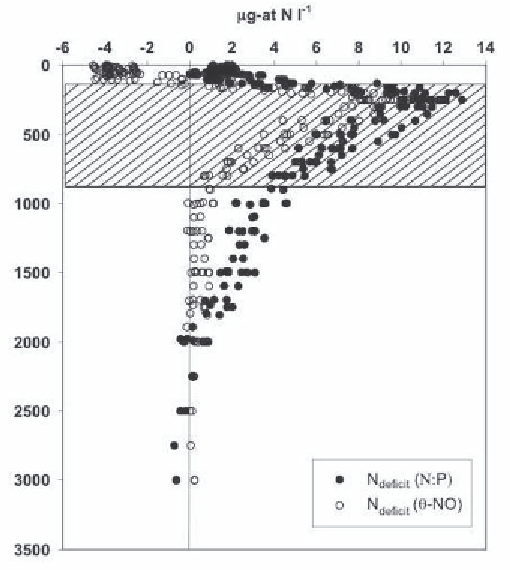
Figure 4.
Comparison of nitrate deficit calculated from θ-NO relationships, and from N:P
regressions. The cross hatched area shows the approximate boundaries of the ODZ. Data used
are US JGOFS data (see caption to Fig 2).
Type II linear regressions of reactive phosphate (PO
4
3
−
)
vs
inorganic nitrogen
(IN=NO
3
−
+NO
2
−
+NH
4
+
) on samples from depths between 100 and1500 db,
with oxygen concentrations
>
65 µM/l to determine the N-P relationship for the
intermediate water before the onset of denitrification. The resulting equation
was:
[(14.89 PO
4
3
−
−
0.86 (
r
2
N
=
0.28)
−
IN]µM
∗
=
0.998),
(5)
deficit
where N
deficit
is the estimate of the inorganic nitrogen removed from a water
parcel by denitrification, 14.89 =
PO
4
3
−
(by atoms), 0.28 is the PO
4
3
−
intercept at IN, and 0.86 accounts for the PO
4
3
−
released by the organic material
re-mineralized by denitrification assuming that N/P in local organic matter is
14.89, and that consumption of 94.4 NO
3
−
by denitrification releases one PO
4
3
−
[38, 81]. Partially because this equation is independent of dissolved oxygen,
it does not result in negative nitrate deficits in the surface layer (Fig 4). The
∆
IN/
∆