Environmental Engineering Reference
In-Depth Information
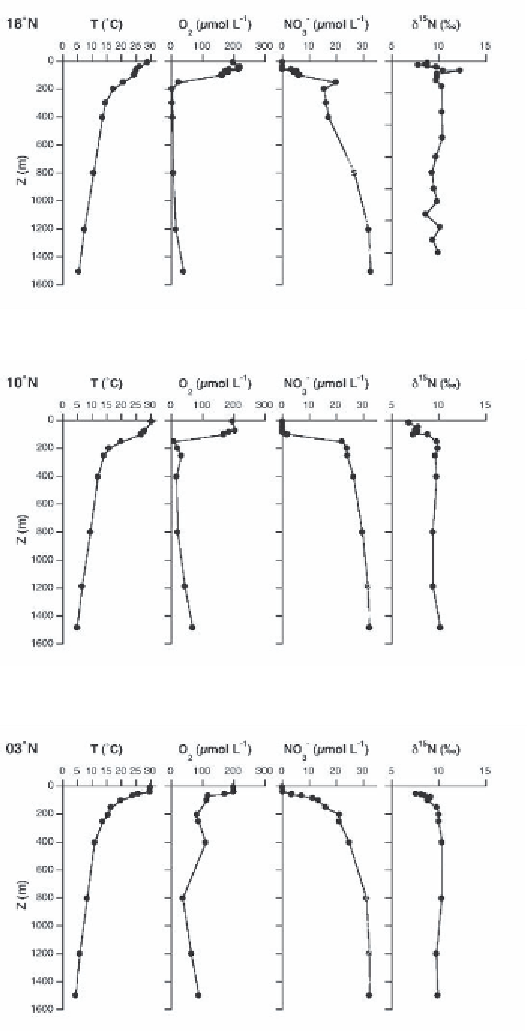
Figure 3.
15
Nofsus-
pended particles at the three time-series stations carried out at 18
◦
N, 10
◦
N, and 3
◦
N.
Profiles of temperature, O
2
concentration, NO
3
−
concentration, and δ