Environmental Engineering Reference
In-Depth Information
20°N
D1
D2
10°N
D3
EQ
50°E
60°E
70°E
80°E
20°N
10°N
EQ
50°E
60°E
70°E
80°E
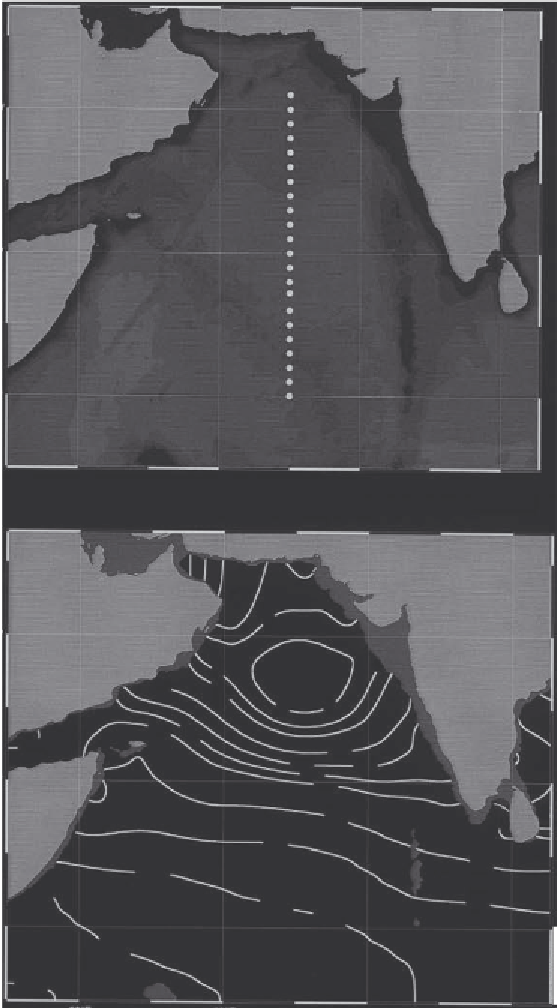
Figure 2.
Charts showing stations occupied during cruise ME32/3 (upper panel) and climato-
logic distribution of O
2
(µmol L
−
1
) at 300 m depth (lower panel). Charts prepared using Ocean
Data View [52] and objectively analyzed data from the World Ocean Atlas 2001.