Environmental Engineering Reference
In-Depth Information
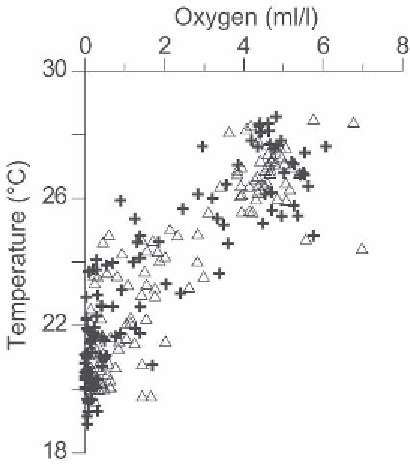
expected, the O
2
data show considerable scatter. However, the range of values
is much wider for the deeper layer (temperature
<
24
o
C) in case of the 1971-75
data set with the recent data clustering toward lower values (Fig. 6). In all cases
the means and medians of subsurface O
2
concentrations are significantly lower
for 1997-2004 than for 1971-1975 (Table 2). Moreover, on no occasion were
the measured O
2
concentrations actually zero during the IFP cruises in contrast
with numerous such values recorded in the recent data set (which are invariably
associated with the presence of H
2
S in concentrations reaching up to
13 µM).
This implies that even though H
2
S was not measured on the IFP cruises, it was
probably not present.
∼
Figure 6.
Comparison of O
2
concentrations with reference to temperatures over the inner- and
mid-shelf regions (depths
<
60 m) off Karwar, central west coast of India, during the upwelling
period in 1971-75 (triangles) and 1997-2004 (crosses). Mean and median concentrations for
various temperature ranges are given in Table 2.
Routine measurements of NO
3
−
and NO
2
−
were not made under the IFP, but
the nutrient data subsequently collected on cruises conducted by the National
Institute of Oceanography (NIO) [38, supplementary information], indicate that
the subsurface environment was denitrifying, but not SO
4
2
−
reducing, at least
until the 1980s. These observations lead us to conclude that the subsurface O
2
deficiency over the Indian shelf has intensified significantly since the 1970s, and
that SO
4
2
−
reduction in the region, not recorded previously, is a manifestation
of this change. The cause of this regime shift cannot be pinpointed with absolute